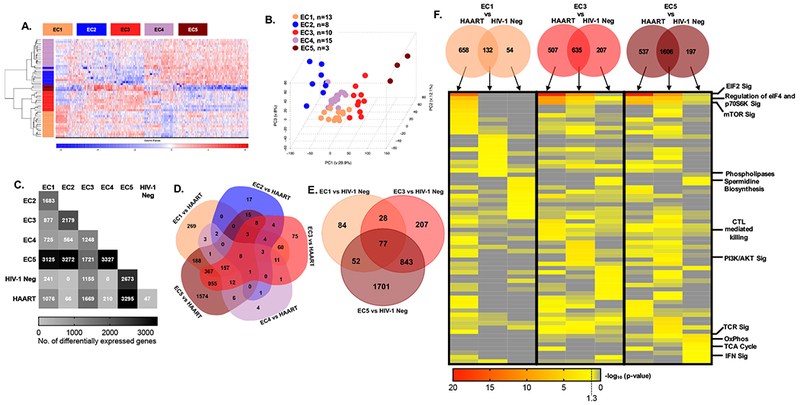
Figure 3: Transcriptional profiling of CD8+ T cells identifies distinct subgroups of EC.

(A) Heat map showing differentially expressed genes among five EC subgroups identified using a bootstrapping approach; 49 out of 51 EC patients who met the analysis criteria described in the methods section were included. (B) PCA analysis of EC subgroups. (C) Matrix diagram indicating the frequency of differentially expressed genes between EC subgroups as well as HIV-1 negative and HAART treated patients. (D-E) Venn diagrams depicting the number of differentially-expressed genes distinguishing EC subgroups from HAART-treated patients (D) or HIV-1 negative study persons (E). No statistically significant transcriptional differences were detected between EC2 vs HIV-1 negative persons or EC4 vs HIV-1 negative study subjects. (F) Transcripts that distinguish EC1, 3, and 5 from HAART (C, D) and HIV-1 negative (C, E) CD8+ T cells were used to generate the Venn diagrams demonstrating genes differentially expressed between indicated EC subgroups and either HAART-treated individuals, HIV-1 negative study subjects or both. The columns of the heat map correspond to the individual segments of the Venn diagram as indicated by the arrows. Heat map depicts unbiased analysis of top ten canonical pathways enriched in each indicated gene set as determined using IPA. Selected pathway annotations are indicated on the right of the heat map.
