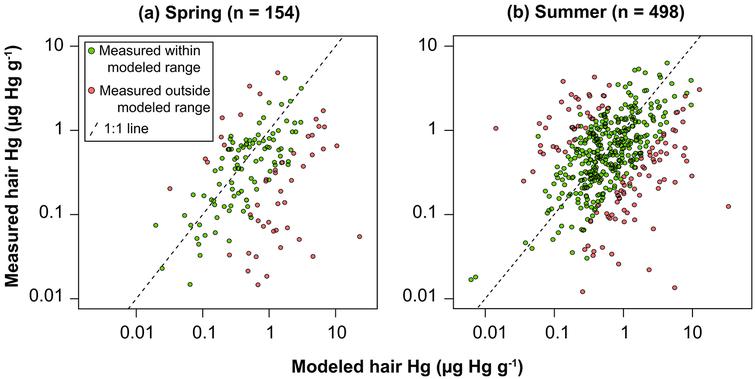
Figure 1.
Comparison of measured and probabilistically modeled hair Hg concentrations for Labrador Inuit in the Lower Lake Melville Region during Spring and Summer survey periods. Green circles indicate measured values that fall within the modeled range. Red circles indicate measured values that fall outside the probabilistically modeled range of hair Hg concentrations. Individuals who did not report consuming seafood, birds or marine mammals (8 in Spring, median hair Hg = 0.036 μg g−1 and 26 in Summer, median hair Hg = 0.049 μg g−1) are excluded. R2 = 0.13 (Spring), 0.11 (Summer).

