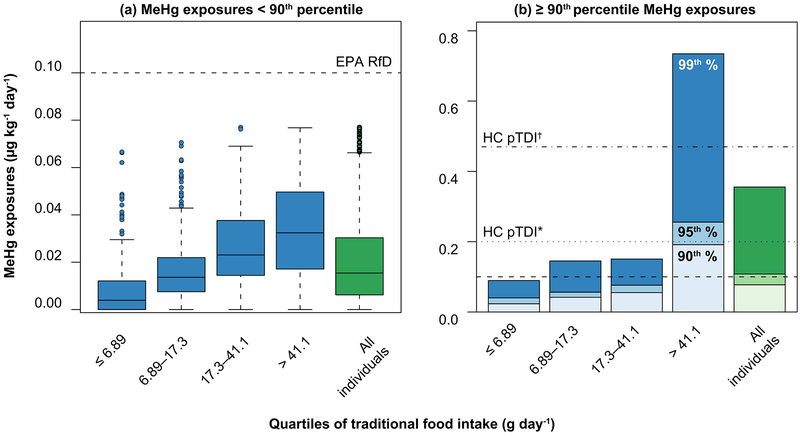
Figure 2.
Distributions of MeHg exposures for Inuit in the Lower Lake Melville Region of Labrador by quartile of traditional food consumption (Summer 2014). Panel (a) shows values below the 90th percentile of MeHg exposures and Panel (b) shows the distribution for highly exposed individuals in the population (at or above 90th percentile of MeHg exposures). EPA RfD denotes the U.S. EPA reference dose for methylmercury and HC pTDI indicates the Health Canada provisional tolerable daily intakes for women of childbearing age and children (*) and for everyone else (†).

