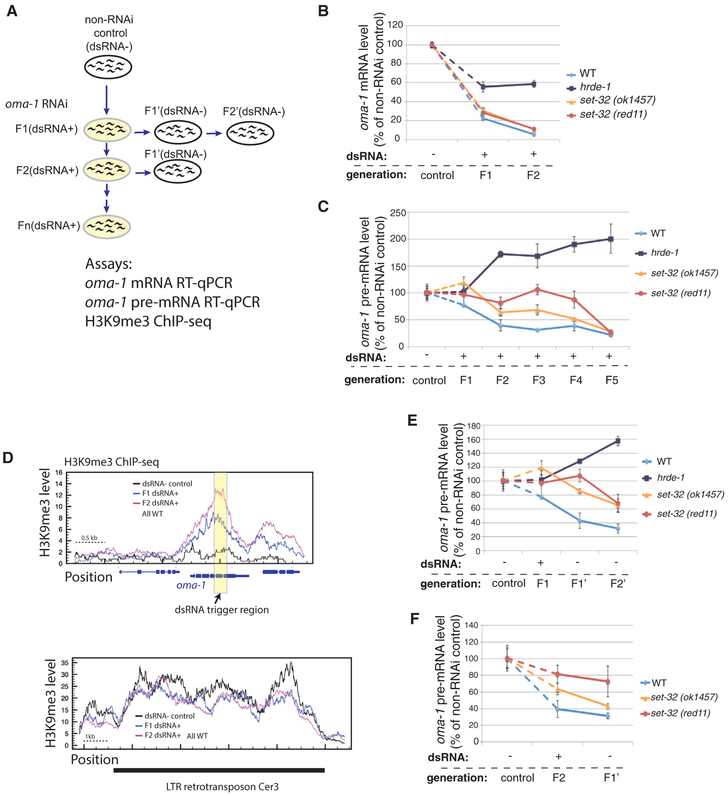
Figure 1. Multigenerational Analysis of Exogenous dsRNA-Triggered RNAi at oma-1.
(A) A schematic of the experiment. F1–F5(dsRNA+), adult animals fed on oma-1 dsRNA-expressing E. coli for one to five generations, were used to test the establishment of silencing. F1’ and F2’(dsRNA−), the first and second generation after shifting from oma-1 dsRNA+ to dsRNA−, were used to test the inheritance of silencing.
(B) oma-1 mRNA RT-qPCR analysis of the control (dsRNA−), F1(dsRNA+), and F2(dsRNA+) samples.
(C) oma-1 pre-mRNA RT-qPCR analysis of the control (dsRNA−) and F1–F5(dsRNA+) samples. This is one of two biological replicates for this experiment. The second one is shown in Figure S1.
(D) H3K9me3 ChIP-seq coverage plots for the oma-1 locus (top panel) and LTR retrotransposon Cer3 (bottom panel). Wild-type animals of control (dsRNA−), F1(dsRNA+), and F2(dsRNA+) were used. Cer3, used as a control locus here, is an endogenous HRDE-1 target with a high level of H3K9me3, which is not affected by oma-1 RNAi. All profiles are normalized by total reads aligned to the whole genome.
(E) oma-1 pre-mRNA RT-qPCR analysis of the progeny (F1’[dsRNA−] and F2’[dsRNA−]) of the F1(dsRNA+) animals.
(F) oma-1 pre-mRNA RT-qPCR analysis of the progeny (F1’[dsRNA−]) of the F2(dsRNA+) animals. The values for the control, F1(dsRNA+), and F2(dsRNA+) samples from (C) are also used in (E) and (F) for comparison. Each RT-qPCR result in (B), (C), (E), and (F) represent the mean value of n = 3; whiskers represent the SD.

