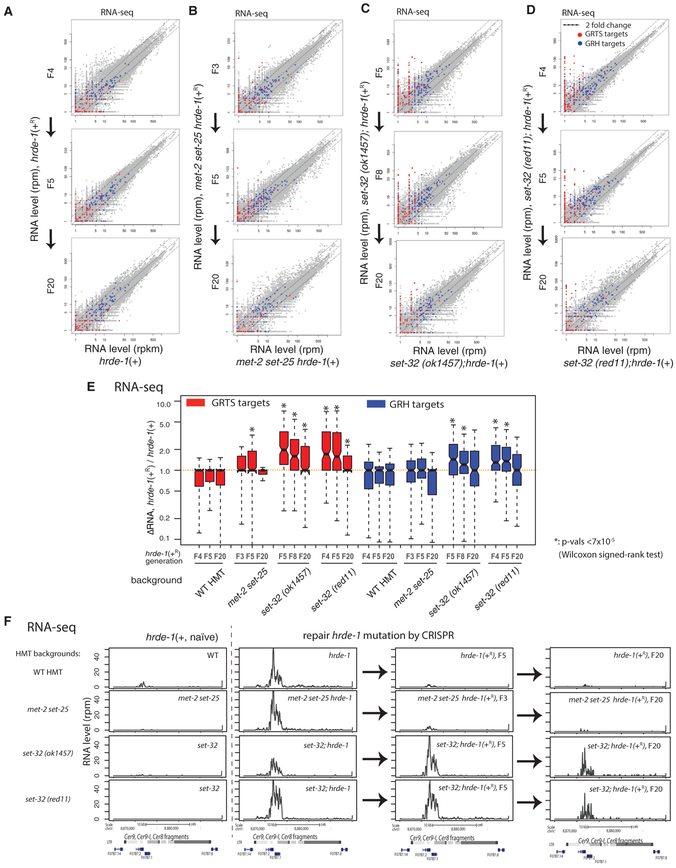
Figure 3. RNA-Seq Analysis of Silencing Establishment at Endogenous HRDE-1 Targets.
(A–D) Scatterplot analysis of normalized RNA-seq counts for all 1-kb genomic regions comparing animals in the post-conversion generations with animals of the same genotype but without experiencing hrde-1 mutation (naive samples). (A) Wild-type set-32;met-2 set-25 background, (B) met-2 set-25 double-mutant background, (C) set-32(ok1457) background, and (D) set-32(red11) background. GRTS and GRH regions (see Figure 1 legend for their definitions) are colored in red and blue, respectively.
(E) Boxplot analysis of the changes in RNA expression of GRTS or GRH regions between post-conversion animals and the corresponding naive samples.
(F) An exemplary endogenous HRDE-1 target (LTR retrotransposon Cer9) that is defective in silencing establishment in the set-32 mutant for at least 20 generations, but not in the met-2 set-25 mutant. Normalized total RNA-seq signals were plotted. Columns from left to right are the naive samples (hrde-1[+]), pre-conversion samples (hrde-1[−]), and F5 and F20 post-conversion samples (hrde-1[+R]). Different genetic backgrounds (wild-type [WT] or various H3K9 HMT mutants) are in different rows as indicated. All results represented here are normalized by total reads aligned to the whole genome.*p<7 ×10⁻⁵ (Wilcoxon singed-rank test).

