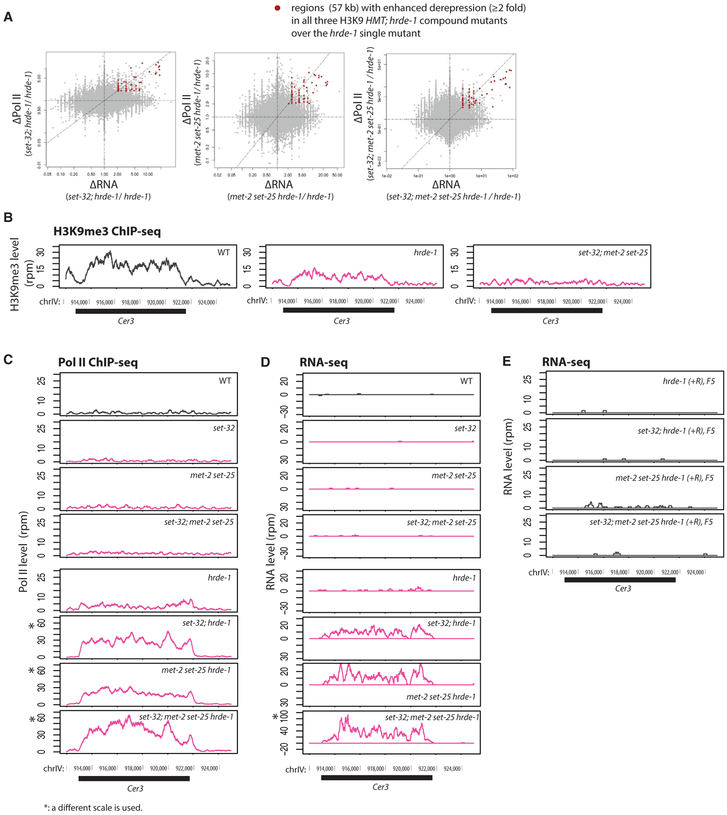
Figure 4. Enhanced Silencing Defects in the Endogenous HRDE-1 Targets Caused by the Combination of H3K9 HMT and hrde-1 Mutations.
(A) Scatterplots with changes in RNA-seq signals between a compound mutant and hrde-1 single mutant plotted in the x axis and changes in Pol II ChIP-seq signals plotted in the y axis for all 1-kb genomic regions. Regions with ≥ 2-fold increases in both RNA expression and Pol II occupancy in all three H3K9 hmt;hrde-1 compound mutants over hrde-1 single mutant were marked with red dots.
(B–D) The H3K9me3 ChIP-seq (data from Kalinava et al., 2017) (B), Pol II ChIP-seq (S2 phosphorylated) (C), and RNA-seq (D) coverage plots at the LTR retrotransposon Cer3 in WT and various mutant animals. Panels marked with an asterisk (*) use a different scale to accommodate the enhanced expression levels observed for the genotype.
(E) RNA-seq profiles at Cer3 for post-conversion samples (hrde-1[+R/+R]) with WT H3K9 HMT genes or various H3K9 HMT mutations. All results represented in this figure are normalized by total reads aligned to the whole genome.

