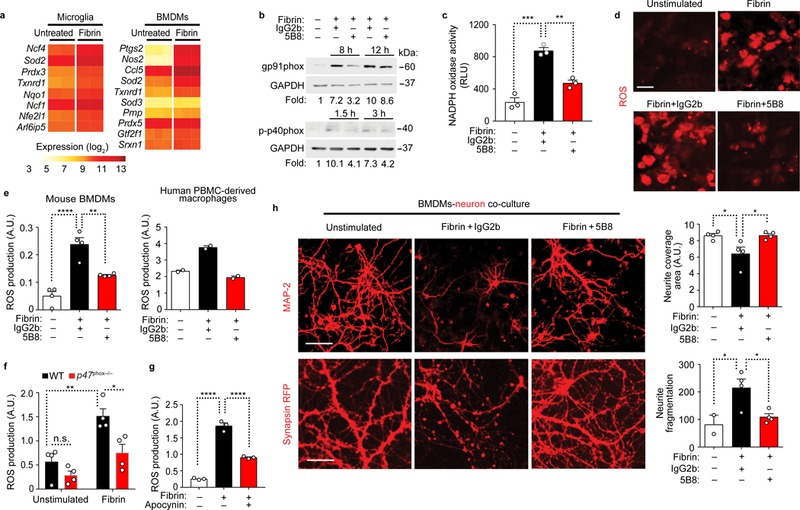
Fig. 3 │. 5B8 blocks fibrin-induced ROS production and axonal damage.

a, Heat map of significantly differentially expressed ROS-related genes in fibrin-induced microglia and BMDMs (|log2 fold change| > 0.585 and FDR < 0.05; two-tailed moderated t-test). b, Immunoblot for gp91phox and p-p40phox in BMDMs stimulated with fibrin as indicated in the presence of 5B8 or IgG2b. Representative cropped blot images from 3 independent experiments are shown. Full blots are included in Supplementary Fig. 9. c, NADPH oxidase activity in 12 h fibrin-stimulated BMDMs in the presence of 5B8 or IgG2b. Data are mean ± s.e.m. of 3 independent experiments. RLU, relative chemiluminescent light units. ** P = 0.0015 and *** P = 0.0001 by one-way ANOVA with Tukey’s multiple comparisons test. d, ROS production by fibrin-stimulated BMDMs detected with dihydroethidium (DHE, red). Scale bar, 10 μm. Data are representative of three independent experiments with similar results. e, Quantification of ROS production by DHE in BMDMs (left) and human PBMC-derived macrophages (right) 48 h after fibrin stimulation in the presence of 5B8 or IgG2b. Data are mean ± s.e.m. of 4 (left graph) and 2 (right graph) independent experiments. A.U., arbitrary units. ** P = 0.0033, **** P <0.0001 (mouse BMDMs) by one-way ANOVA with Bonferroni multiple comparisons test. f, ROS production 24 h after fibrin stimulation in BMDMs isolated from WT and p47phox–/– mice. Data are mean ± s.e.m. of n = 4 mice per group. A.U. * P = 0.0204, ** P = 0.0040 by two-way ANOVA with Sidak’s multiple comparisons test. n.s., not significant. g, ROS production measured by DHE in murine BMDMs 24 h after fibrin stimulation in the presence of apocynin. Data are mean ± s.e.m. of 3 independent experiments. A.U.-- **** P < 0.0001 by one-way ANOVA with Tukey’s multiple comparisons test. h, MAP-2+ (upper panel) and synapsin-RFP (lower panel) cortical neurons co-cultured with unstimulated or fibrin-stimulated BMDMs in the presence of 5B8 or IgG2b. Scale bars, 50 μm (top panels) and 30 μm (bottom panels). Quantification of MAP-2+ neurites (top) and synapsin-RFP+ neurites (bottom). Data are mean ± s.e.m. from 4 independent experiments * P = 0.0385 (unstimulated vs Fibrin+IgG2b, top), * P = 0.0370 (Fibrin+IgG2b vs Fibrin+5B8, top); * P = 0.0168 (Fibrin+IgG2b vs Fibrin+5B8, bottom) by one-way ANOVA with Bonferroni multiple comparisons test.
