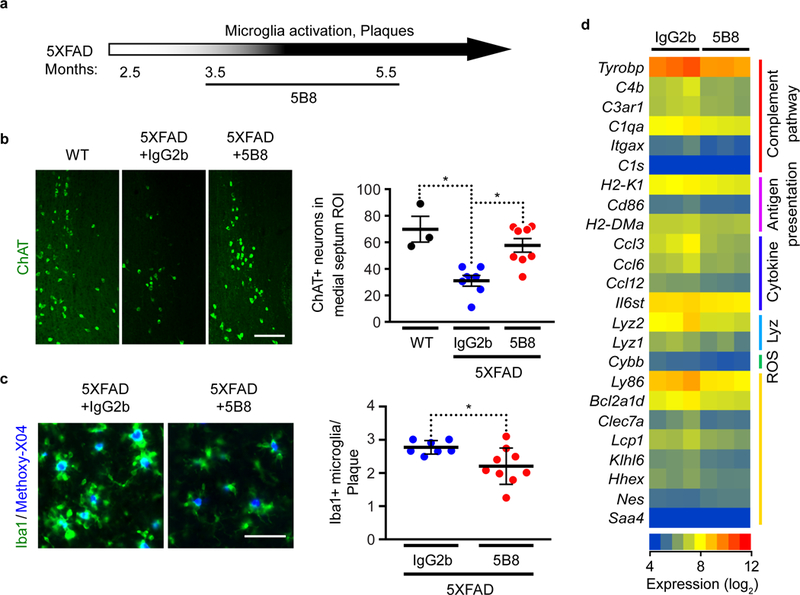
Fig. 7 │. 5B8 protects against neurodegeneration and inflammatory responses in 5XFAD mice.

a, Schematic representation of 5B8 administration after appearance of plaques and microglia activation in 5XFAD mice (800 μg i.p. every other day for 2 months starting at 3.5 months of age). b, ChAT-positive cholinergic neurons in the medial septum of non-transgenic littermate control (WT), 5XFAD mice treated with IgG2b or 5B8. Scale bars 80 μm. Quantification of ChAT+ neurons. Data are mean ± s.e.m.; n = 3 WT, n = 7 IgG2b-treated and n = 8 5B8-treated 5XFAD mice. * P = 0.0211 (WT vs IgG2b), * P = 0.0157 (IgG2b vs 5B8) by Kruskal–Wallis with Dunn’s multiple comparisons test. c, Iba-1+ cells (green) around Methoxy-X04+ plaques (blue) in the cortex of 5XFAD mice treated with IgG2b or 5B8. Quantification of plaque-associated Iba-1+ microglia. Scale bar: 50 μm. Data are mean ± s.e.m.; n = 7 IgG2b-treated and n = 9 5B8-treated 5XFAD mice. * P = 0.0337 by two-tailed Mann-Whitney test. d, Affymetrix microarray gene expression analysis in the cortex of 5B8- or IgG2b-treated 5XFAD mice. Linear models were fitted for each gene using the Bioconductor ‘limma’ package in R. Moderated t-statistics, fold change and the associated P values were calculated for each gene (two-tailed, raw P < 0.05). Heatmap of select genes with differential expression patterns from GO terms were identified by GO-Elite analysis.
