
Figure 3. Changes in Gi upon coupling to the μOR.
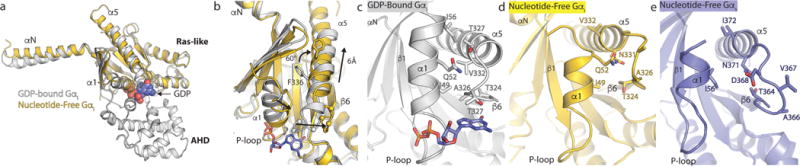
a, b, Comparison of GDP-bound Gαi (PDB 1GP2, grey) and nucleotide-free Gαi from the μOR-Gi complex (gold). GDP is shown as blue spheres in panel a and sticks in panel b. The primary differences between these two structures are the opening and outward movement of the alpha helical domain (AHD), and an upward shift of the α5 helix by 6Å to engage the receptor core. The α-carbons of the TCAT motif are represented as spheres in panel b. The TCAT motif coordinates the guanosine base of GDP. The upward shift of the α5 helix and repositioning of the TCAT motif leads to nucleotide release. c, d, e, The interface between the α1 helix and the N-terminal end of the α5 helix and TCAT motif for GDP-bound Gαi (c), nucleotide free Gαi (d), and nucleotide free Gs from the β2AR -Gs complex (e). The upward movement of the α5 helix disrupts the interaction between the α1 and α5 helices leading to changes in the P-loop that coordinates the phosphates of GDP.