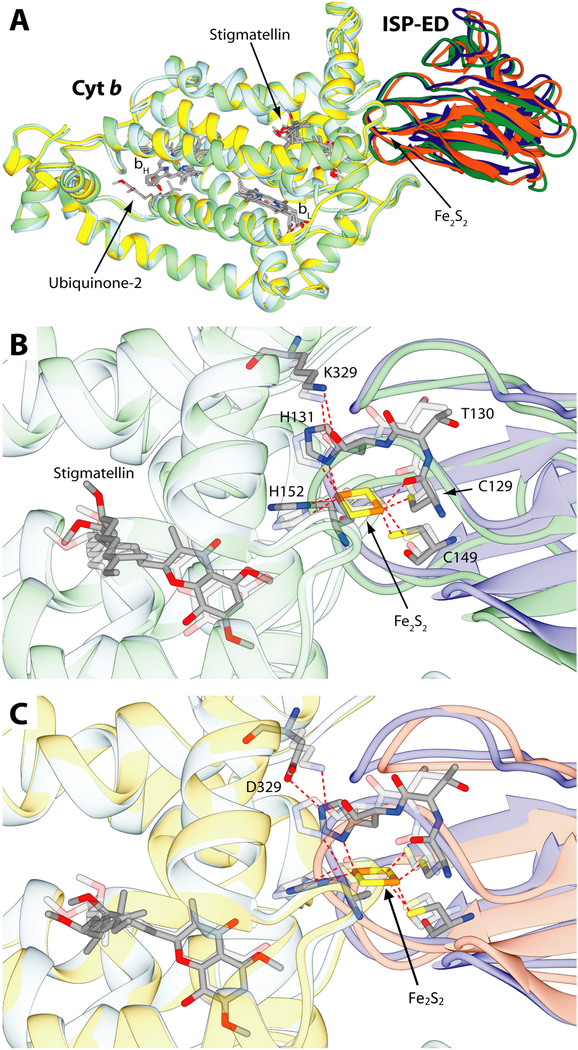
Figure 10.
Results of the docking calculations performed on cyt b and ISP-ED from R. sphaeroides and comparison with the starting crystal structure (PDB code: 2QJY). A- Ribbon representation of cyt b and ISP-ED from the crystal structure colored in light blue and blue, respectively superimposed to the result of the docking calculations in the case of the wild-type cyt b (light green and green) and the K329D mutant (yellow and orange). The cyt b ~ ISP-ED complexes were superimposed through the optimal match of the position of the cyt b Cα. The heme groups together with the Fe2S2 cluster and the ubiquinone and stigmatellin ligands are shown as sticks colored accordingly to the atom type. (B and C)- Detail of the cyt b ~ ISP-ED complex, with B, comparing computer simulated wild type structure and C, computer simulated mutant structure to the wild type crystal structure, respectively. Ribbons are colored as in panel A and were made partially transparent for clarity. Residues and ligands cited in the text are reported as sticks colored according to the atom type. Residues from the crystal structure were also made transparent for clarity. S-Fe, N-Fe and hydrogen bonds are reported as dashed red lines.

