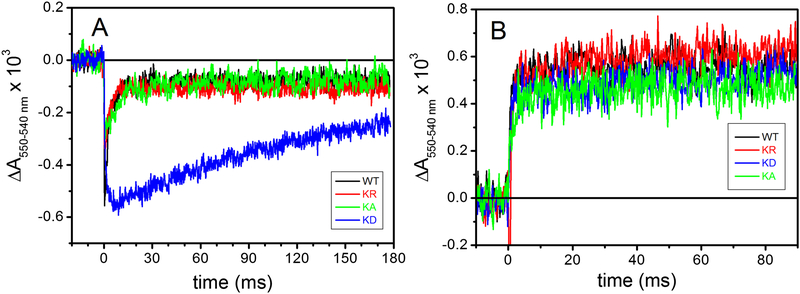
Figure 7. The effect of K329 mutations on cyt c kinetics.
A- cyt c reduction kinetics after a single flash, recorded in uninhibited chromatophores, normalized to the total extent of cyt c oxidation detected in the presence of 1 μM stigmatellin. Except for normalization, the traces are the same plotted in Figure 5, but they have been shown over a longer time scale. B- Kinetic traces obtained by subtracting cyt c kinetics in the presence of stigmatellin from those recorded in the presence of antimycin/myxothiazol (blue-red traces from Figure 5). Experimental conditions as in Figure 5, color code as in figure 4.

