Figure 3.

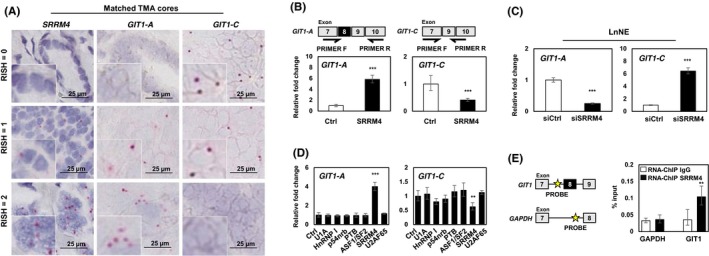
SRRM4 regulates RNA splicing of GIT1. A, Matched TMA cores are shown to represent the associations of the expressions of SRRM4 with GIT1‐A and GIT1‐C. Scale bars represent 25 μm. B, LNCaP cells were transfected with 4 μg flag‐SRRM4 and subsequently extracted for RNA. Relative expressions of GIT1‐A or GIT1‐C were compared to 18S by RT‐qPCR. Primer pairs designed for unique exon junctions in GIT1‐A and GIT1‐C variants are illustrated. C, NEPC cell model, LnNE, was transfected with 20 μmol/L siRNA targeting SRRM4 or negative control siRNA to determine the splicing activity of GIT1. D, Various RNA splicing factors (4 μg) or control (empty vector) were transfected into LNCaP cells and subsequently extracted for RNA. RT‐qPCR was carried out to compare GIT1 splice variant expression compared to 18S (one‐way ANOVA; n = 3; ** and *** denotes P < 0.01 and P < 0.001, respectively). E, RNA‐ChIP probes for the intron sequence upstream of the alternatively spliced microexon (exon 8) of GIT1 and probes for negative‐control gene GADPH were created, as indicated by the yellow star. RNA‐ChIP was carried out with LNCaP cells transfected with 10 μg Flag‐SRRM4 and immunoprecipitated with anti‐Flag antibody. RNA fragments were eluted and used as templates for the antisense primers/probes by RT‐qPCR. All experiments were repeated three times. Unless otherwise indicated, results are presented as mean ± SD (Student's t test, n = 3; **P < 0.01; ***P < 0.001). Ctrl, control; GIT1, G‐protein‐coupled receptor kinase‐interacting protein 1; NEPC, neuroendocrine prostate cancer; RISH, RNA in situ hybridization; RNA‐ChIP, RNA‐chromatin immunoprecipitation; TMA, tissue microarray
