
Figure 4.
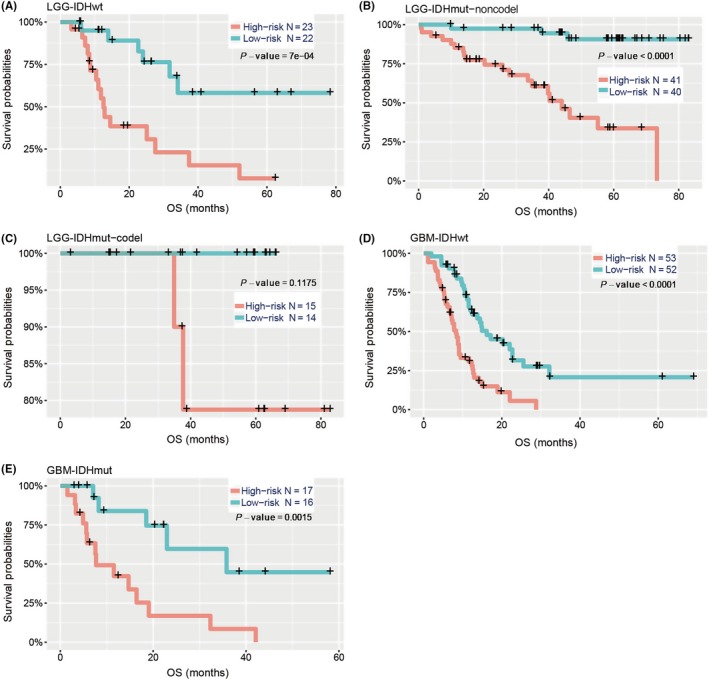
Prediction of outcome in diverse cohorts stratified by IDH mutation and 1p/19q codeletion status. Kaplan‐Meier survival curves for LGG patients with IDH‐wild type (A), IDH‐mutation but not the 1p/19q codeletion (B) and IDH‐mutation with 1p/19q codeletion (C), classified into two groups based on 30‐gene signature‐derived risk scores. Kaplan‐Meier survival curves also show the prognostic value of GBM patients with IDH‐wild type (D) and IDH‐mutation (E) in the CGGA cohort. P‐value is the result of a log‐rank test between the two groups shown in each panel. CGGA, Chinese Glioma Genome Atlas; Codel, codeletion; GBM, glioblastoma; IDH, isocitrate dehydrogenase; LGG, lower‐grade glioma; OS, overall survival