
Figure 6.
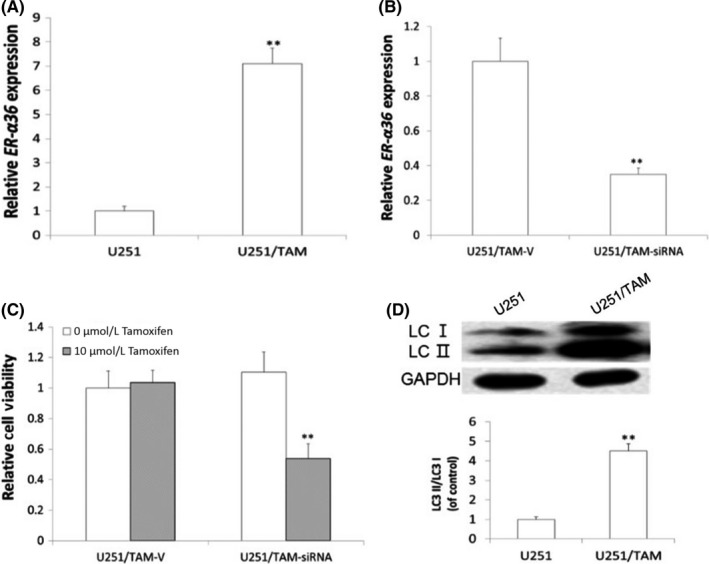
U251/TAM shows increased levels of ER‐α36, together with increased cell autophagy. A, RT‐PCR examination of ER‐α36 expression in U251 and U251/TAM. B, Knockdown of ER‐α36 by shRNA method. RT‐PCR examination of ER‐α36 expression in U251/TAM‐V and U251/TAM‐siRNA. C, MTT analysis of cell viability of glioma cells. D, Western blot analysis of accumulated LC3‐II (n = 4, **P < .01 vs control). ER, estrogen receptor; TAM, tamoxifen