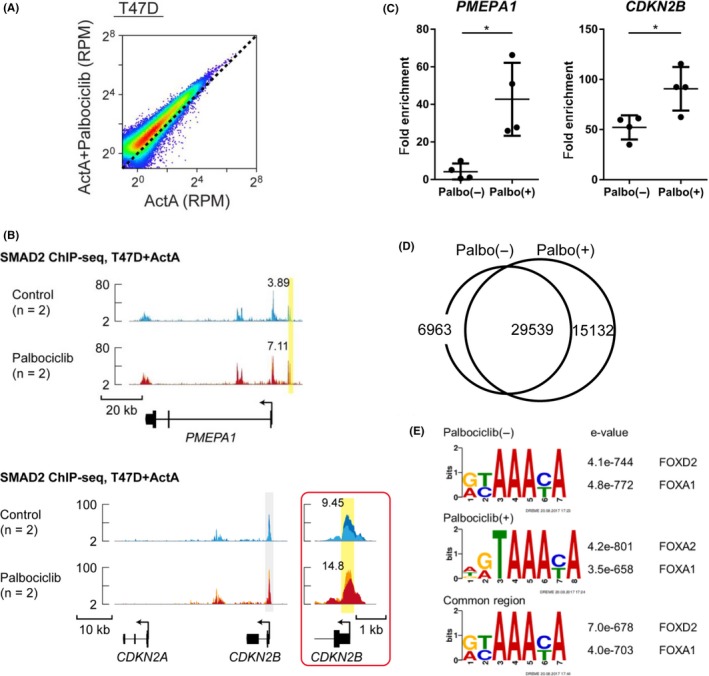
Figure 3.

Palbociclib enhances SMAD2 binding to the genome in T47D cells. A, Scatter plot of differentially enriched sequenced reads in each SMAD2 binding region from ActA‐ and palbociclib‐treated T47D cells (n = 2) and ActA‐only control (n = 2). RPM, reads per million reads. B, PMEPA1 and CDKN2B loci are shown with the SMAD2 ChIP‐seq data of T47D cells treated with or without palbociclib (n = 2 for each condition). Direction of transcription is shown by the arrow beginning at the transcription start site. Inset shows magnification of the region marked by a gray‐colored box. Each ChIP‐seq data is presented in a different color. Values of RPM (averaged from two biological replicates) of peaks, highlighted by yellow boxes, are presented. C, SMAD2 ChIP‐qPCR analysis of T47D cells treated with ActA for 1.5 h with or without 1 μmol/L palbociclib for 24 h. The SOBP gene locus was used as a negative control region, and fold enrichment was calculated. Data represent mean ± SD of n = 4 independent experiments (*P < .05; Welch's t test). D, Venn diagram indicating the overlap of SMAD2 binding sites in T47D cells with or without treatment of palbociclib. E, Transcription factor motif analysis of SMAD2 binding regions in T47D cells
