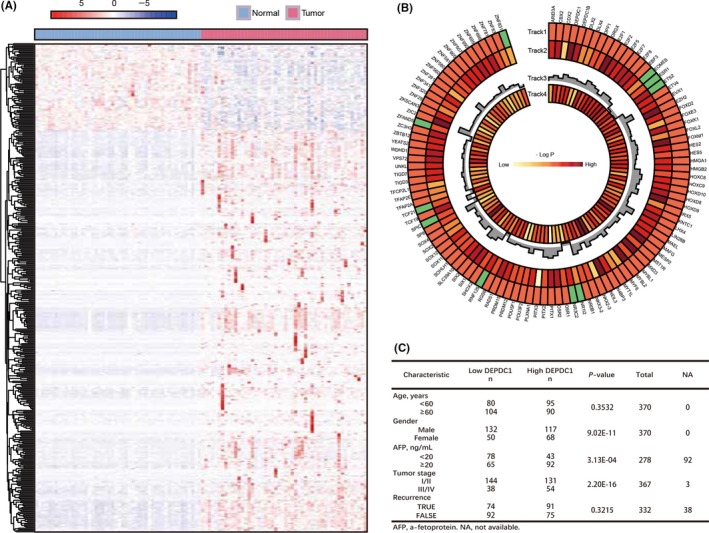
Figure 1.

Transcriptomic analyses of differentially expressed transcription factor genes in The Cancer Genome Atlas (TCGA) liver hepatocellular carcinoma (LIHC) cohort. A, Heatmaps of unsupervised clustering of differently expressed transcription factor genes in 50 pairs of normal and hepatocellular carcinoma (HCC) samples from TCGA LIHC cohort, with rows representing genes and columns representing samples. B, Track 1 shows 100 upregulated (red boxes) and 10 downregulated (green boxes) transcription factor genes in liver HCC samples. P‐values on track 2 were generated from Kaplan‐Meier analysis of overall survival. Track 3 shows the fold‐change of differentially expressed genes, and track 4 shows somatic mutation frequency. Genes whose expression levels were significantly associated with overall patient survival are shown in red. C, Correlation of clinicopathological features with tumor DEP domain containing 1 (DEPDC1) expression level in TCGA LIHC cohort
