
Figure 4.
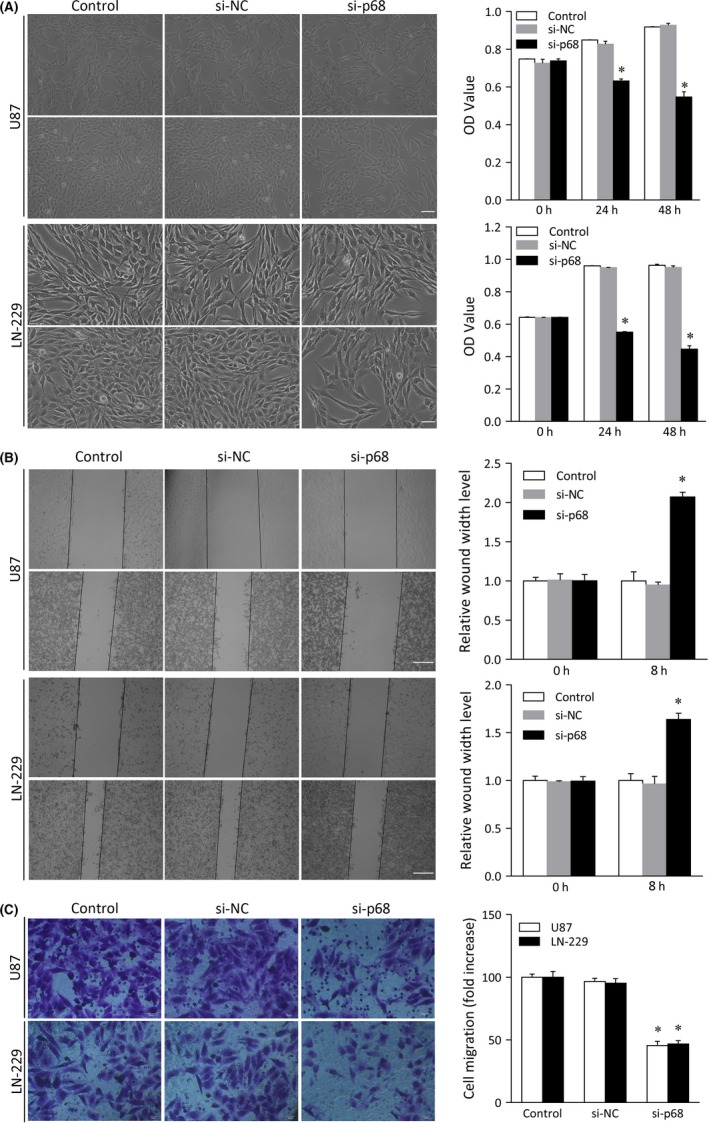
Analysis of cell proliferation, invasion, and migration in glioma cell lines transfected with p68 siRNA. U87 and LN‐229 cells were transfected with control, siRNA negative control (si‐NC), or p68 siRNA. A, MTT assay of U87 and LN‐229 cell proliferation. Scale bar = 50 μm. OD, optical density. B, Wound healing assay of the invasive capacity of U87 and LN‐229 cells and quantitative histogram analysis. Left panels, micrographs of invaded cells; right panels, relative quantitative analysis of the scratch width of invaded cells. Scale bar = 50 μm. C, Transwell assay of U87 and LN‐229 cell migration and quantitative analysis. Bars represent SD; *P < .05