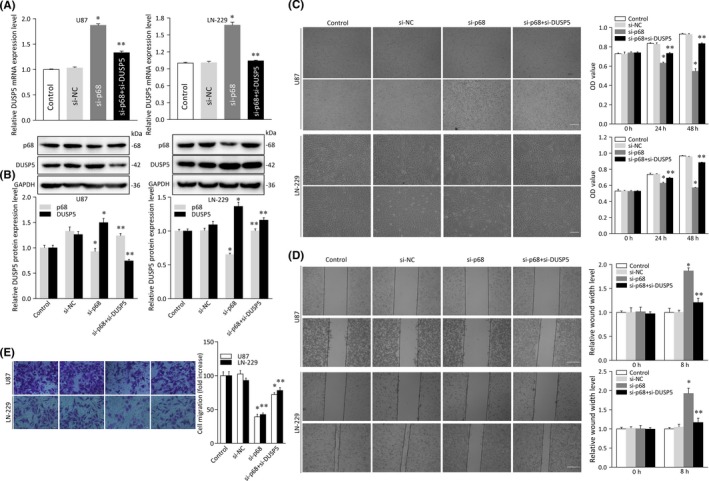
Figure 6.

Analysis of cell proliferation, invasion, and migration in glioma cell lines cotransfected with p68 and dual specificity phosphatase 5 (DUSP5) siRNA. A, Relative mRNA expression of DUSP5 in U87 and LN‐229 glioma cell lines transfected with siRNA control (control), siRNA negative control (si‐NC), or p68 siRNA (si‐P68) and/or DUSP5 siRNA (si‐DUSP5). B, Protein expression of DUSP5 in U87 and LN‐229 cells cotransfected with si‐P68 and si‐DUSP5. Histogram of relative p68 or DUSP5 protein expression levels with relative ratios shown as a percentage of the p68/GAPDH or DUSP5/GAPDH band. C, MTT assay of cellular growth in U87 and LN‐229 cells cotransfected with the siRNAs mentioned above. OD, optical density. D, Wound healing assay of cellular invasive capacity in U87 and LN‐229 cells cotransfected with the siRNAs mentioned above. Left panels, micrographs of invaded cells; right panels, relative quantitative analysis of scratch width in invaded cells shown in left panels. Scale bar = 50 μm. E, Transwell assay of U87 and LN‐229 cells cotransfected with the siRNAs mentioned above. Left panels, micrographs of migrated cells; right panels, relative quantitative analysis of migrated cells shown in left panels. Experiments were repeated three times independently. Bars represent SD; *P < .05, **P < .05 vs adjacent control
