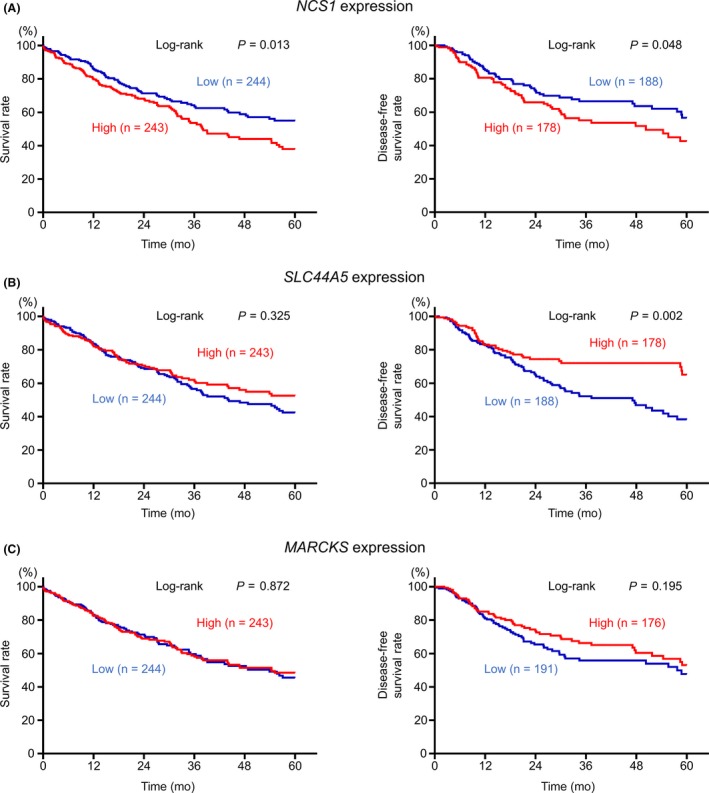
Figure 4.

A, Kaplan‐Meier curve of 5‐year overall survival (OS) and 5‐year disease‐free survival (DFS) according to NCS1 expression among patients with lung squamous cell carcinoma (LUSQ) in The Cancer Genome Atlas (TCGA) database. The prognosis and DFS of patients with LUSQ with high expression of NCS1 was significantly worse than those with low expression (P = 0.013 and P = 0.048, respectively). B, Kaplan‐Meier curve of 5‐year OS and 5‐year DFS according to SLC44A5 expression among patients with LUSQ in TCGA database. There were no significant differences between the prognosis of patients with LUSQ according to SLC44A5 expression (P = 0.325). Conversely, DFS in patients with LUSQ was significantly higher in the high expression group than in the low expression group (P = 0.002). C, Kaplan‐Meier curve of 5‐year OS and 5‐year DFS according to MARCKS expression among patients with LUSQ in TCGA database. There were no significant differences in prognosis or DFS in patients with LUSQ according to MARCKS expression (P = 0.872 and P = 0.195, respectively)
