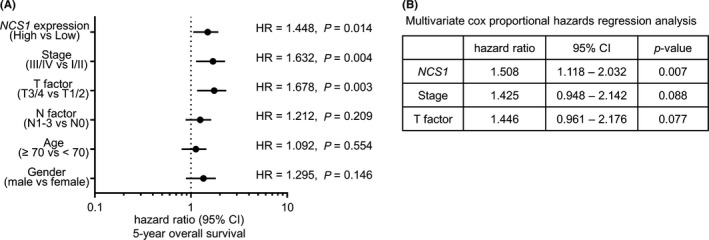
Figure 8.

Analysis of the expression levels of NCS1 in patients with lung squamous cell carcinoma using The Cancer Genome Atlas (TCGA) database. A, Forest plot of univariate Cox proportional hazards regression analysis of 5‐year overall survival using TCGA database. B, Multivariate Cox proportional hazards regression analysis of 5‐year overall survival using TCGA database. CI, confidence interval; HR, hazard ratio
