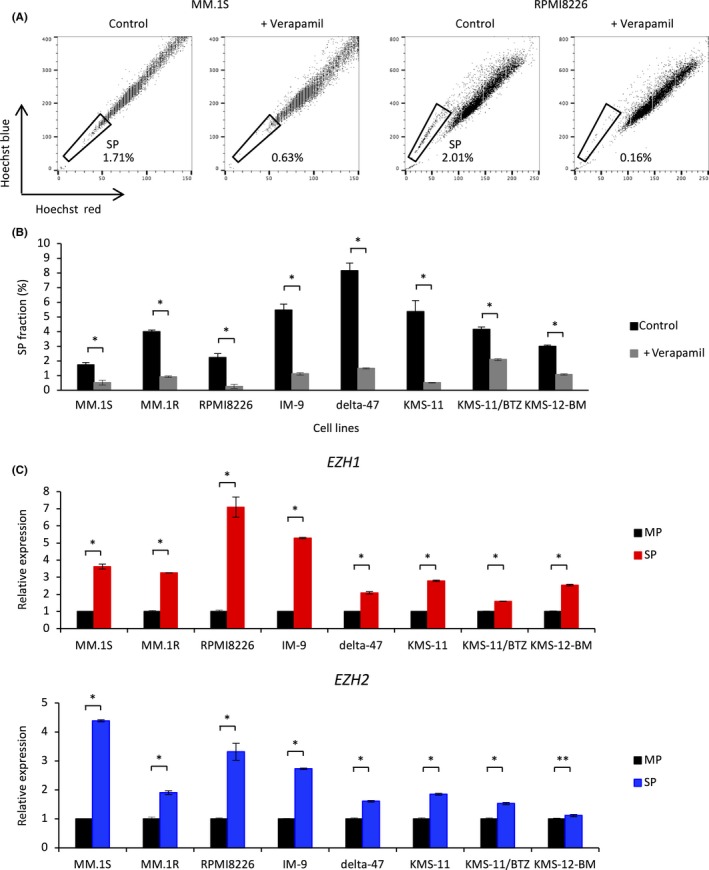
Figure 1.

Side population (SP) cells express significantly higher levels of enhancer of zeste homolog 1/2 (EZH1/2) than main population (MP) cells. A, Representative FACS plots of the SP fraction of MM.1S and RPMI8226 cells. Cells were incubated with Hoechst 33342 alone (left) or together with 100 μmol/L verapamil (right). B, Percentage of SP cells in untreated multiple myeloma (MM) cell lines and those treated with 100 μmol/L verapamil. C, qRT‐PCR analysis showing relative expression of EZH1 and EZH2 in SP and MP cells isolated from MM cell lines by FACS. Expression was normalized against that of ACTB. All error bars represent the mean ± SD. *P < .005; **P < .05 (Student's t test)
