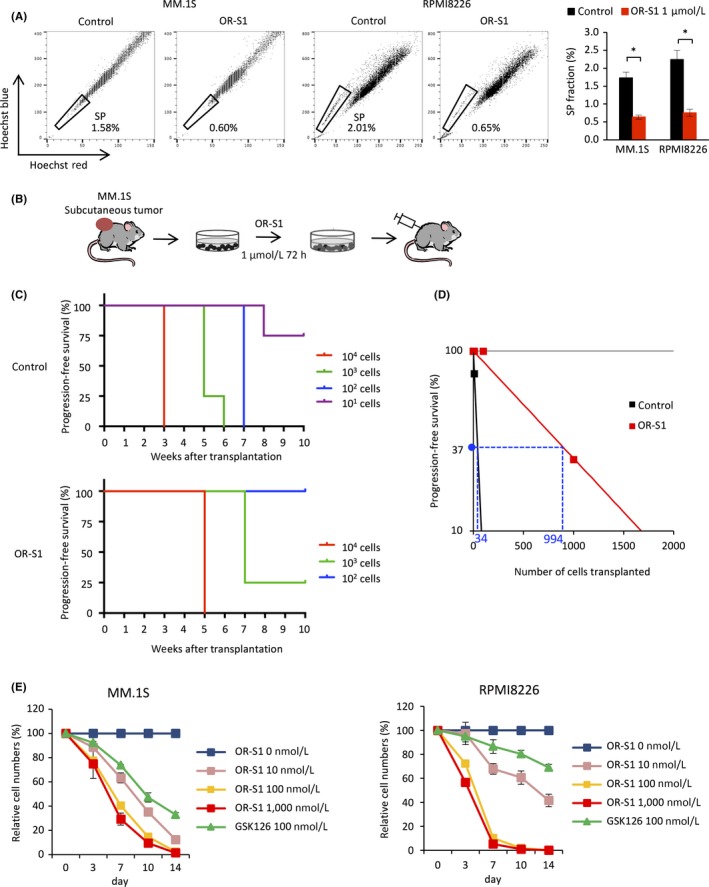
Figure 2.

OR‐S1 has a greater antitumor effect than GSK126 in vitro and depletes myeloma stem cells. A, Representative FACS plots of the side population (SP) fraction of MM.1S and RPMI8226 cells. Cells were incubated with Hoechst 33342 alone (left) or together with 1 μmol/L OR‐S1 (right). Bar graph of the SP fraction of cells treated with or without 1 μmol/L OR‐S1 for 48 h is also shown. Error bars represent the mean ± SD. *P < .001 (Student's t test). B, Experimental schema depicting limiting dilution transplantation of MM.1S cells treated with vehicle or 1 μmol/L OR‐S1 for 72 h. Mice were s.c. injected with 1 × 10⁴, 1 × 10³, 1 × 10², or 1 × 101 cells (n = 4 mice per group). C, Kaplan‐Meier progression‐free survival curves of mice transplanted with vehicle‐ and OR‐S1‐treated cells (n = 4 mice per group). D, Numbers of myeloma‐initiating cells were determined by limiting dilution transplantation of vehicle‐ and OR‐S1‐treated MM.1S cells. E, Relative proliferation of MM.1S and RPMI8226 cells treated with different concentrations of OR‐S1 and 100 nmol/L GSK126 for the indicated durations. Y‐axis shows the cumulative cell number as a percentage relative to vehicle‐treated cells. Data are expressed as the mean of triplicates (±SD)
