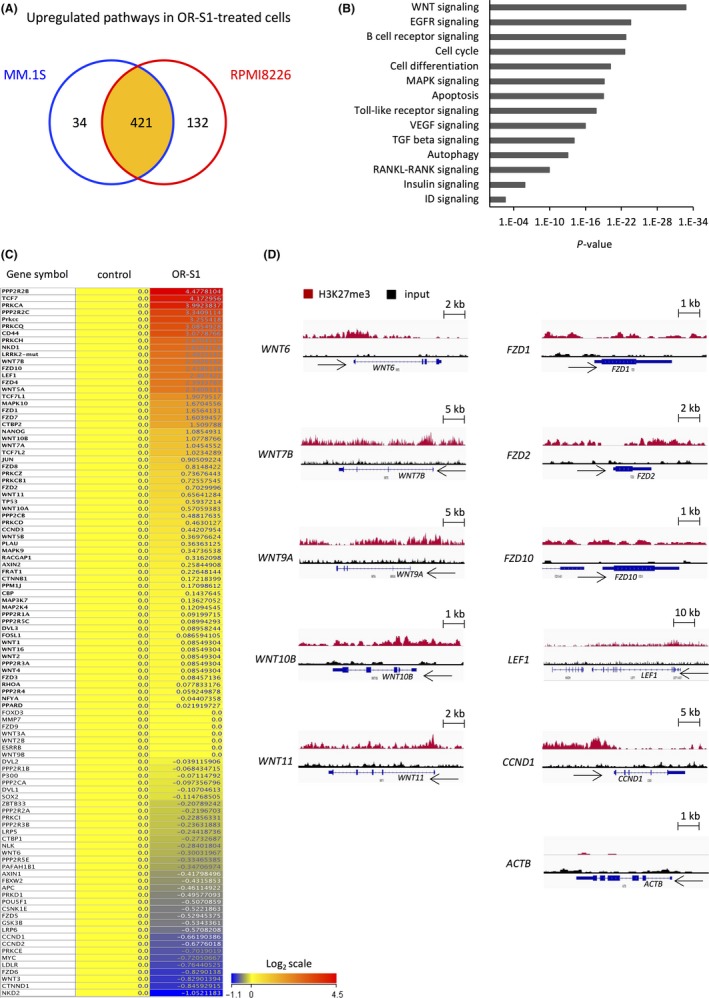
Figure 3.

RNA‐seq and ChIP‐seq analysis of OR‐S1‐treated multiple myeloma (MM) cells. A, Schema showing upregulated pathways in OR‐S1‐treated MM.1S and RPMI8226 cells determined by RNA‐seq. A total of 455 and 553 pathways were significantly upregulated in MM.1S and RPMI8226 cells treated with 1 μmol/L OR‐S1 for 72 h, respectively (P < .05), and 421 pathways were upregulated in both OR‐S1‐treated cell lines. B, List of upregulated pathways in OR‐S1‐treated RPMI8226 cells determined by RNA‐seq. C, Heatmap of WNT‐related genes expressed in RPMI8226 cells treated with or without 1 μmol/L OR‐S1 for 72 h (log2 scale). Expression levels were normalized within two replicates of each sample. D, Representative Integrated Genomics Viewer diagrams showing the distribution of ChIP‐seq read densities for H3K27me3 (red) and input (black) at loci of WNT family members in RPMI8226 cells. CCND1 and ACTB loci were used as positive and negative controls, respectively
