Figure 5.

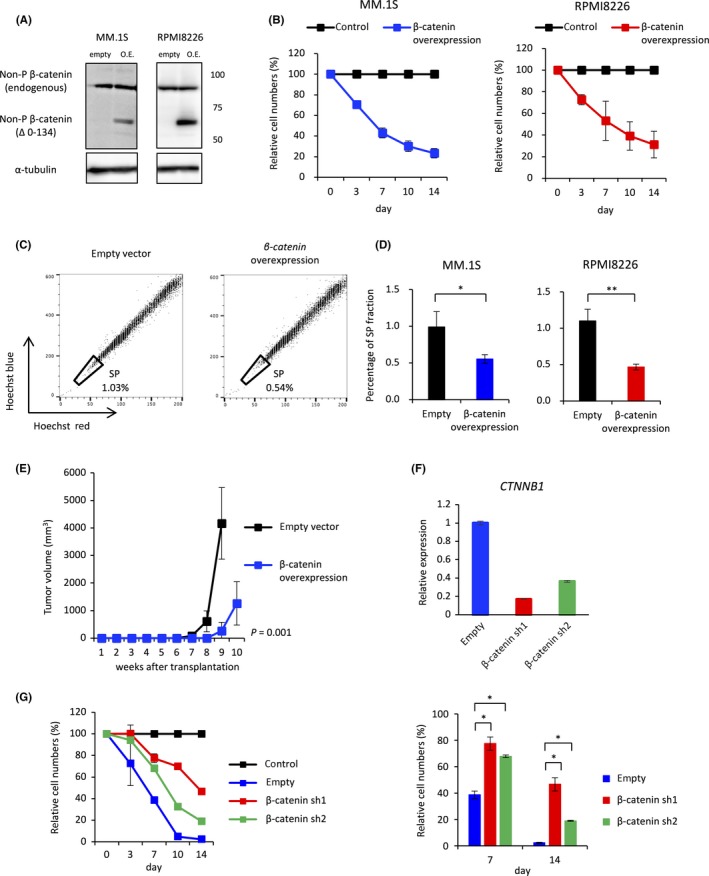
Repression of WNT signaling by Polycomb repressive complex 2 (PRC2) is important to maintain the stemness of multiple myeloma (MM) cells. A, Western blot analysis to confirm overexpression of non‐phosphorylated (active) β‐catenin in MM.1S and RPMI8226 cells. Empty represents cells transduced with pMSCV‐neo. Overexpression (O.E.) represents cells transduced with pMSCV‐β‐catenin (ΔN134)‐neo. B, Relative proliferation of β‐catenin‐overexpressing MM.1S and RPMI8226 cells at the indicated time points. Y‐axis shows cumulative cell number as a percentage relative to control cells. Data are expressed as the mean of triplicates (±SD). C, Representative FACS plots of the side population (SP) fraction of control and β‐catenin‐overexpressing MM.1S cells. D, Bar graphs show the SP fraction of control and β‐catenin‐overexpressing MM.1S and RPMI8226 cells. Error bars represent the mean ± SD. *P < .05 and **P < .01 (Student's t test). E, Tumor volume in mice s.c. transplanted with 1 × 10⁴ MM.1S cells transfected with non‐phosphorylated β‐catenin or the empty vector (n = 4 mice per group). F, qRT‐PCR analysis showing relative expression of β‐catenin (CTNNB1) in RPMI8226 cells infected with lentiviruses harboring β‐catenin‐targeting shRNA or the empty vector. Y‐axis represents the fold‐change in gene expression after normalization against that of ACTB. G, Relative proliferation of β‐catenin‐knockdown (β‐catenin‐sh1 or ‐sh2) RPMI8226 cells treated with 10 nmol/L OR‐S1 for the indicated durations. Y‐axis shows the cumulative cell number as a percentage relative to vehicle‐treated cells. Data are expressed as the mean of triplicates (±SD). *P < .0001 (Student's t test)
