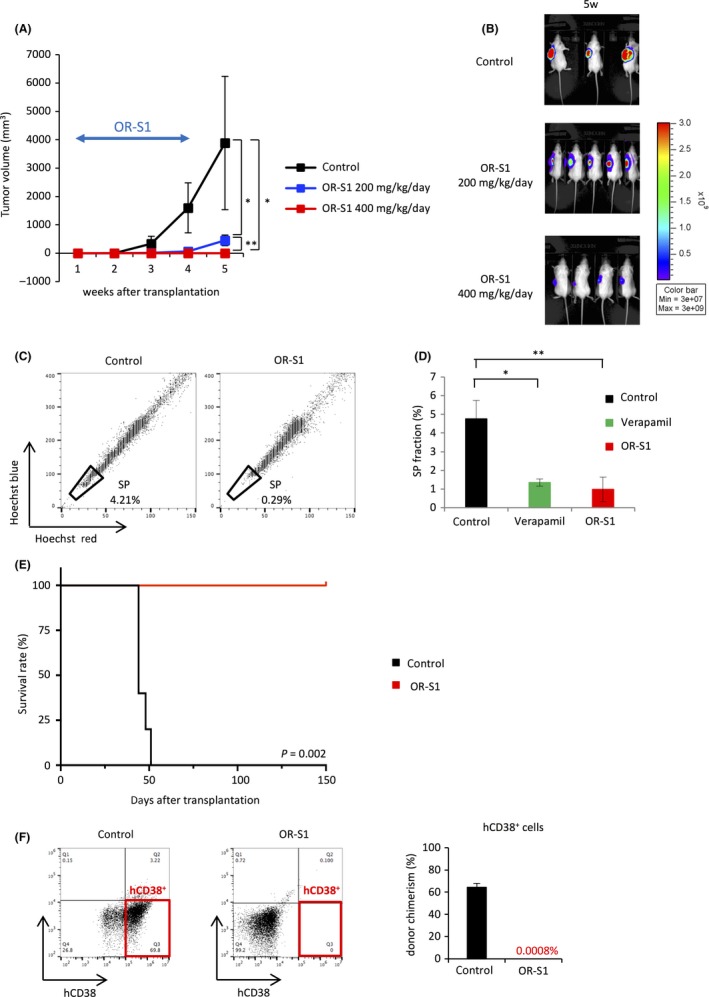
Figure 6.

OR‐S1 shows anti‐neoplastic activity in multiple myeloma (MM) xenografts. A, Tumor volume in mice s.c. transplanted with MM.1S‐Luc+ cells. Treatment with OR‐S1 (200 or 400 mg/kg per day orally for 21 d) was started 1 wk after transplantation when tumor engraftment was confirmed by the bioluminescence imaging (n = 7 per group). B, Representative bioluminescence images show tumor burden of MM.1S xenografts at 5 wk after transplantation in mice treated with OR‐S1 (200 or 400 mg/kg per day orally for 21 d) or vehicle. C, Representative FACS plots of the side population (SP) fraction in s.c. tumors formed by MM.1S cells. OR‐S1 (400 mg/kg per day orally) was given for 14 d after the tumors were palpable. D, Bar graph of the SP fraction in control mice incubated with or without 100 μmol/L verapamil and OR‐S1‐treated mice is shown (n = 4 per group). E, Kaplan‐Meier survival curves of mice bearing orthotopic xenografts after i.v. injection of MM.1S cells. OR‐S1 mixed with sterilized pellet food was given continuously from 3 d after transplantation (n = 5 mice per group). F, Representative FACS plots and the bar graph show the percentage of hCD38+ cells within the bone marrow of control and OR‐S1‐treated mice at the final follow up (n = 5 mice per group). All error bars represent the mean ± SD. *P < .01; **P < .001 (Student’s t test)
