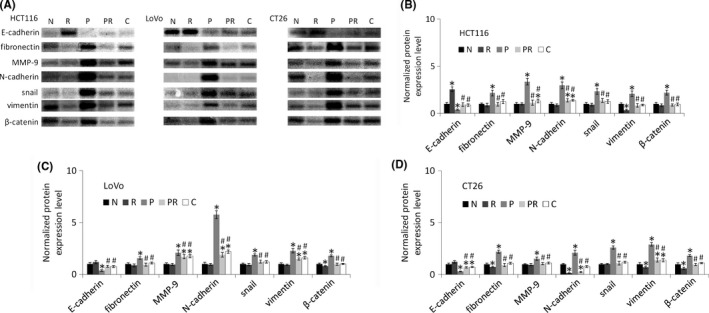
Figure 3.

Western blot analysis of E‐cadherin, fibronectin, MMP‐9, N‐cadherin, snail, vimentin, and catenin in colorectal cancer cell lines. “N” are parental cells, “R” are parental cells treated with all‐trans‐retinoic acid (ATRA) for 48 h, “P” are paclitaxel‐resistant cells, “PR” are paclitaxel‐resistant cells treated with ATRA for 48 h, and “C” are Cx43 transfected paclitaxel‐resistant cells. A, Western blot images. β‐Actin in Figure 2 was used as the loading control for all proteins in this figure. B‐D, Bar diagrams of densitometric analysis. “R”, “P”, “PR” and “C” were compared with “N” using Student's t test. “PR” and “C” were compared with “P” using Student's t test. *P < .05 represents a significant difference from “N”, and #P < .05 represents a significant difference from “P”
