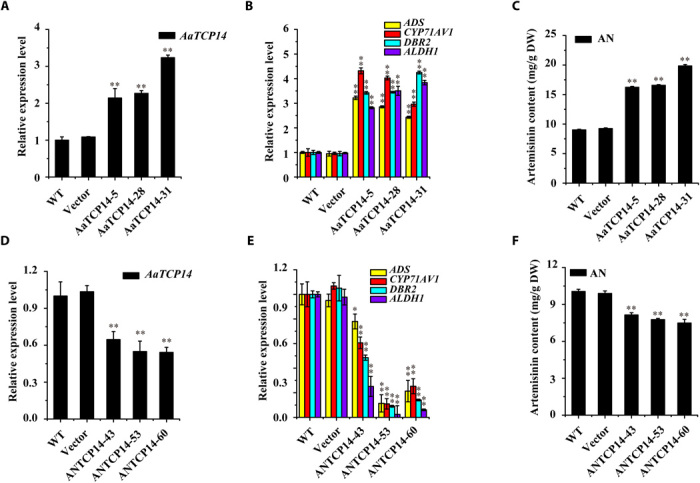
Fig. 3. Analysis of AaTCP14 transgenic plants.

(A and D) Expression levels of AaTCP14 in different A. annua AaTCP14 overexpression (A) and antisense lines (D), plants transformed with the empty vector, and WT plants. Actin was used as the internal standard. (B and E) Expression levels of ADS, CYP71AV1, DBR2, and ALDH1 in different A. annua AaTCP14 overexpression (B) and antisense lines (E), plants transformed with the empty vector, and WT. Actin was used as the internal control. (C and F) HPLC analysis of artemisinin (AN) in the leaves of different A. annua AaTCP14 overexpression (C) and antisense lines (F), plants transformed with the empty vector, and WT. All data represent the means ± SD of three replicates from three cutting propagations. *P < 0.05, **P < 0.01, Student’s t test.
