
Figure 3.
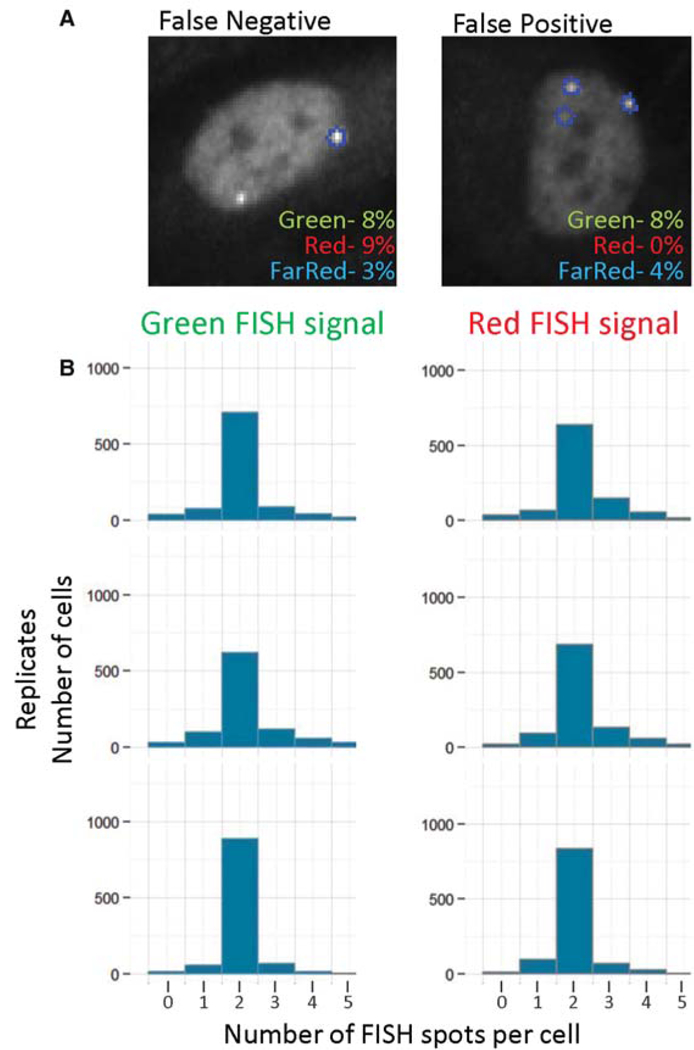
Accuracy of HIPMap image analysis. (A) Representative images of maximally projected z-stacks. The false FISH spot detection ratewas determined by cross comparison of automatically determined spots to manual detection for more than 300 cells in 15 randomly sampled fields. (B) Number of FISH spots detected by image analysis software per cell, calculated for at least 700 cells perwell. Replicate wells are shown for green (488-nm) and red (561-nm) channels