
Figure 5.
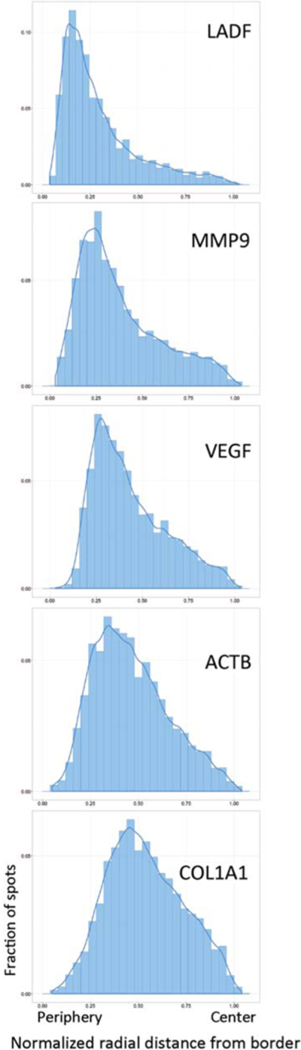
Distributions of endogenous loci. Radial distance distributions (bars) and estimated density curves (lines) of the indicated gene locus. Distributions are generated from more than 600 FISH spots per locus.
Official websites use .gov
A
.gov website belongs to an official
government organization in the United States.
Secure .gov websites use HTTPS
A lock (
) or https:// means you've safely
connected to the .gov website. Share sensitive
information only on official, secure websites.
Distributions of endogenous loci. Radial distance distributions (bars) and estimated density curves (lines) of the indicated gene locus. Distributions are generated from more than 600 FISH spots per locus.