
Figure 6.
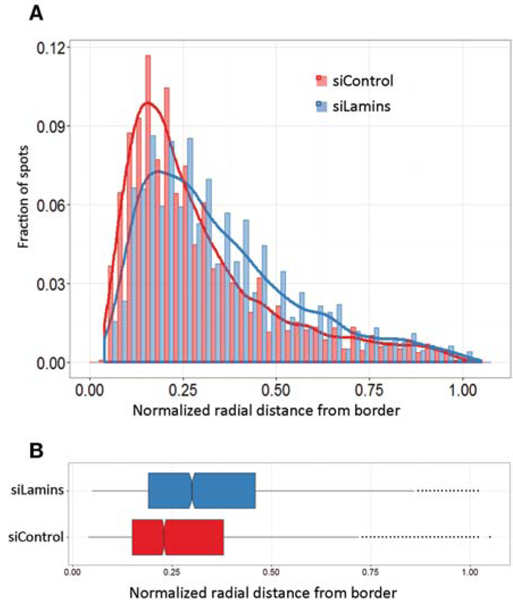
HIPMap detects changes in positioning. (A) Radial distance distributions following siRNA transfection for the indicated gene of the LADF locus. (B) Boxplot of radial distances of the LADF locus to the nucleus border in cells treated with the indicated siRNA for 72 h. Boxes are 25th, 50th (median), and 75 th percentile of the distributions and whiskers extend up to 1.5 interquantile range; outliers are shown as dots.