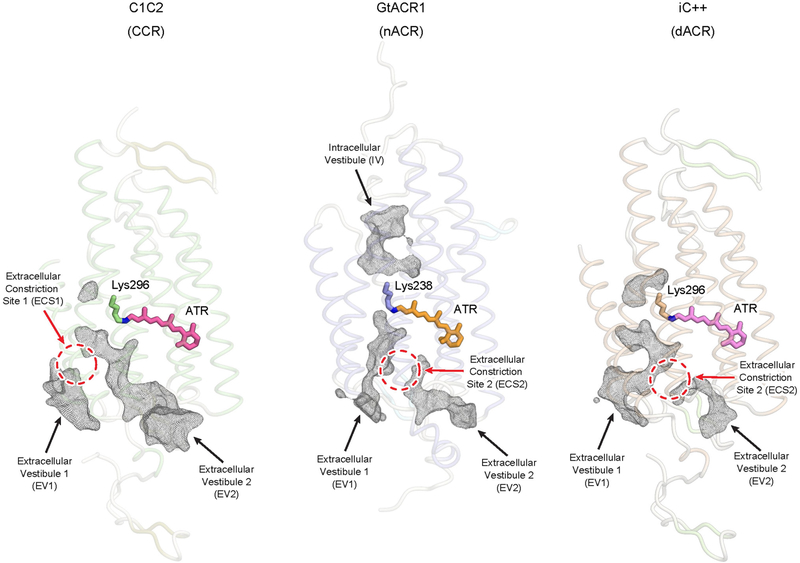
Extended Data Fig. 4 |. Ion-conducting pathways.
Ion-conducting pathways of C1C2 (left), GtACR1 (middle) and iC++ (right). Black meshes represent the extracellular and intracellular vestibules. Red dashed circles represent ECSs. Note that EV1 and EV2 of iC++ are structurally more similar to the extracellular vestibules of GtACR1 than those of C1C2.

