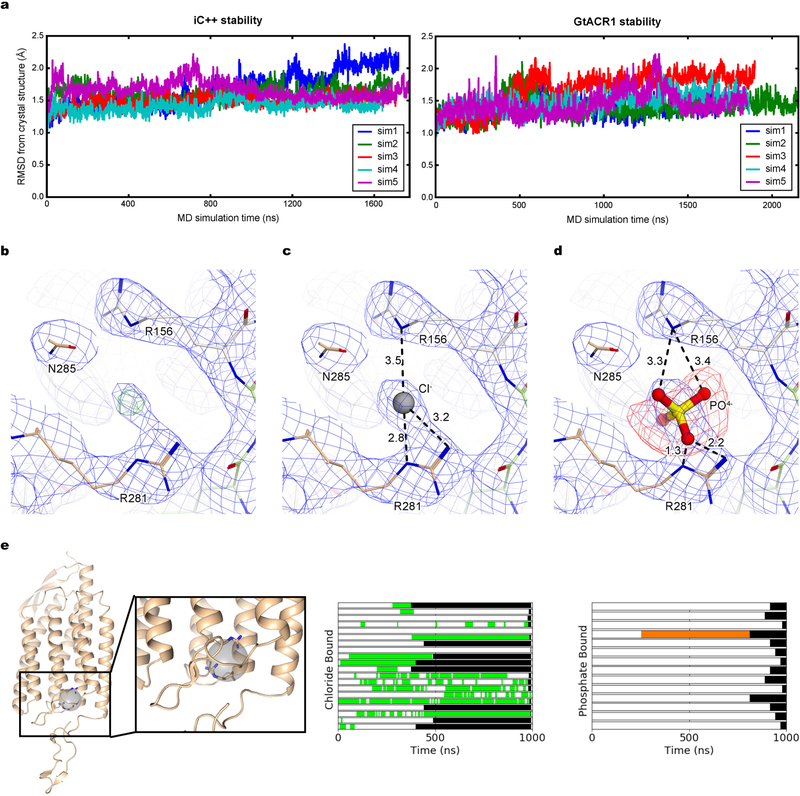
Extended Data Fig. 5 |. Computational and crystallographic estimation of the potential chloride-binding site in iC++ at pH 8.5.
a, The r.m.s.d. of the atomic positions of α-carbons between the crystallographic structures and structures from molecular dynamics simulations was used to assess the stability of the crystal structures in a membrane environment and the quality of our molecular dynamics simulation parameters. The r.m.s.d. values computed from five independent simulations, each over 1500 ns in length, of iC++ (left) and GtACR1 (right), average less than 2 Å, supporting the stability of the crystal structures. In our calculations, we removed the flexible C-terminal tails of both proteins (residue 312 and 251 onwards in iC++ and GtACR1, respectively) and the first eight residues of GtACR1. b, 2 Fo − Fc map (blue mesh, contoured at 1σ) and Fo − Fc omit map (green mesh, contoured at 4σ) for electron density around the putative chloride-binding site. c, d, 2Fo − Fc map for the same site, with a chloride ion (c) and with a phosphate (d). Note the strong negative peak observed around phosphate ion. Numbers indicate distance between two atoms connected by dashed lines. e, Chlorides frequently occupy a site near Arg281 and Arg156 on the extracellular side of iC++, during molecular dynamics simulation. The left panel depicts this binding site as a grey sphere from the perspective looking out from the dimer interface with the extracellular side at the top. Arg281 and Arg156 are shown as sticks. The other two panels show intervals of simulation in which a chloride (middle) or phosphate (right) are present in the binding site. Each horizontal bar represents an individual replicate and monomer. Time periods where a chloride or phosphate bound are coloured green and orange, respectively, and the period after the end of the simulation is coloured black.

