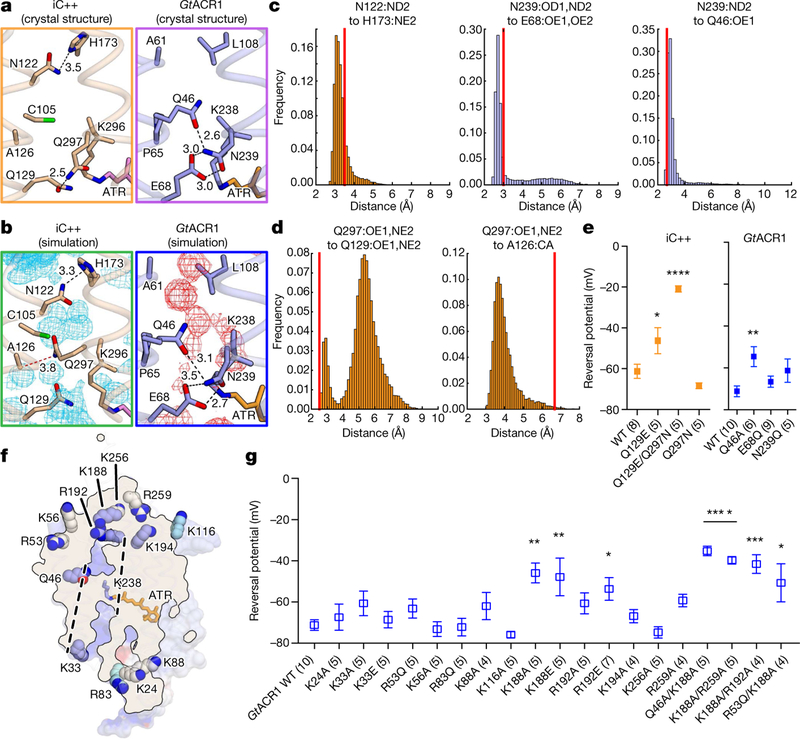
Fig. 3 |. Structural basis of ion selectivity in iC++ and GtACR1.
a, Crystal structures of iC++ (left) and GtACR41 (right) constriction sites. Dashed lines represent hydrogen-bonding interactions with distances shown in Å. b, Molecular dynamics simulation snapshots of the iC++ (left) and GtACR1 (right) constriction sites. Black and red dashed lines represent hydrogen bonding and van der Waals interactions, respectively. Water density maps are contoured at a probability density of 0.016 molecules per Å3. c, d, Distance histograms for N122–H173 (left), N239–E68 (middle) and N239–Q46 (right) (c), Q297–Q129 (left) and Q297–A126 (right) (d) during simulation. e, Vrev summary for CCS mutations. (*P =0.025, **P =0.007, ****P = 0.0001, left to right, respectively) f, Positively charged residues near the ion-conducting pore of GtACR1. Dashed lines represent the putative ion-conducting path. Residues on helices, β-sheets and loops are coloured blue, cyan and white, respectively. g, Vrev summary for mutations of the residues shown in f (*P <0.05, **P <0.01, ***P = 0.0003, ****P =0.0001). Distances in the crystal structure are marked as red lines in histograms (c, d). Data are mean ± s.e.m.; one-way ANOVA followed by Dunnett’s test. Sample size (number of cells) indicated in parentheses.

