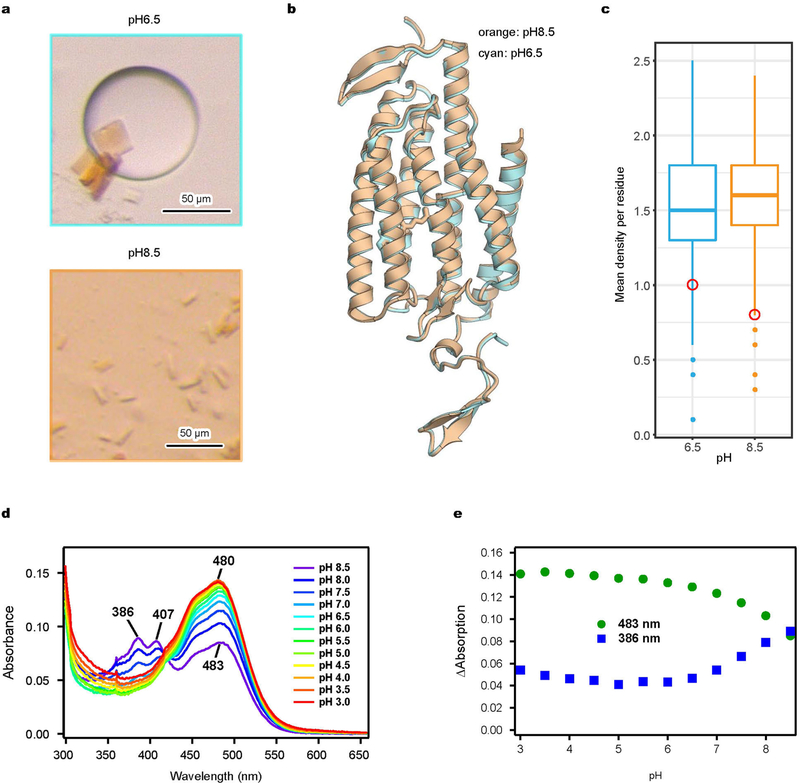
Extended Data Fig. 2 |. Structural basis of pH dependence.
a, Bright-field images of iC++ crystals formed under pH 6.5 (top) and pH 8.5 (bottom) conditions. b, Overlay of iC++ crystal structures at pH 6.5 (cyan) and pH 8.5 (orange). c, Comparison of calculated mean electron density of ATR atoms (red circle) to the distribution corresponding to protein residues (box-and-whisker plots) at pH =6.5 (cyan) or 8.5 (orange). Note lower mean electron density of ATR at pH 8.5 despite higher electron density of the overall structure. Mean values at atomic positions of the 2 Fo − Fc map were calculated using phenix.get_cc_mtz_pdb in Phenix26. Box plots show median (centre), first and third interquartile ranges, minimum and maximum. Sample size (number of residues used in calculation), n =282 for pH 8.5, and 283 for pH 6.5. Electron-density values were normalized in the model region, and maps were generated at 3.2 Å resolution. d, e, Absorption spectrum of iC++ measured over the range from pH 3.0 to pH 8.5 (d), and 483 nm and 386 nm absorbance traces collected across the measured pH range (e). Absorbance was measured for every 0.5 pH unit change while the sample was titrated by HCl. Note increased absorption at 386 nm and decreased absorption at 483 nm under alkaline conditions.

