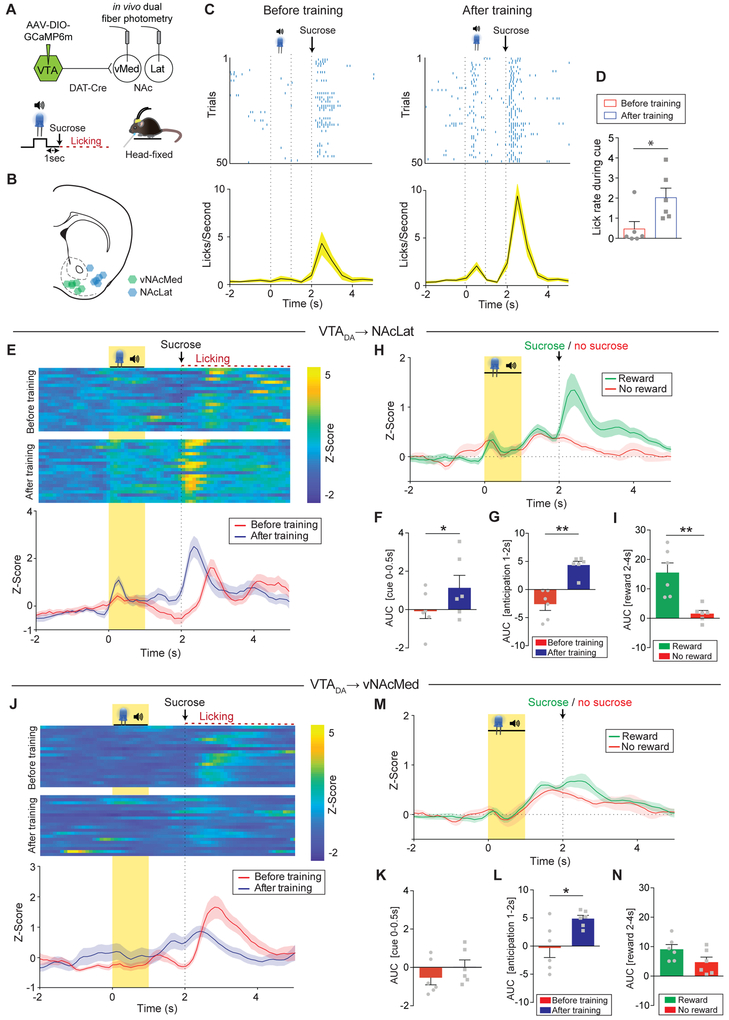
Figure 2. Phasic responses to reward-predictive cues dominate in NAcLat DA terminals.
(A) Schematic of experimental design.
(B) Schematic of fiber implant locations in the vNAcMed and NAcLat.
(C) Top: Representative raster plot of licks around cue presentation and reward delivery in the first 50 trials before (first session, left) and after training (fifth session, right). Bottom: Average lick rate of all mice during the first 50 trials of the first (left) and fifth session (right; data represent means ± SEM).
(D) Average lick rate during cue presentation (* p < 0.05; data represent means ± SEM).
(E) Top: Representative heat maps for NAcLat DA terminals showing individual Z-scores during the first 20 successful trials before (first session, above) and after training (fifth session, below). Bottom: Z score averages of the above heat maps (Data represent means ±SEM).
(F) Mean response to the CS before (red) and after (blue) training (* p < 0.05; quantified as AUC during cue onset; data represent means ± SEM).
(G) Mean AUC during reward anticipation (delay period) before (red) and after (blue) training (** p < 0.01; data represent means ± SEM).
(H) Comparison of Z score averages for NAcLat GCaMP6m fluorescence during reward (green) and omission trials (red; 80% reward probability; data represent mean ± SEM); recorded during the last conditioning day (day 5).
(I) Mean AUC during reward delivery (quantified as AUC) for reward (green) and omission (red) trials (** p < 0.01; data represent means ± SEM).
(J-N) Same as in (E-I) but for DA terminals in the vNAcMed (* p < 0.05; data represent means ± SEM).

