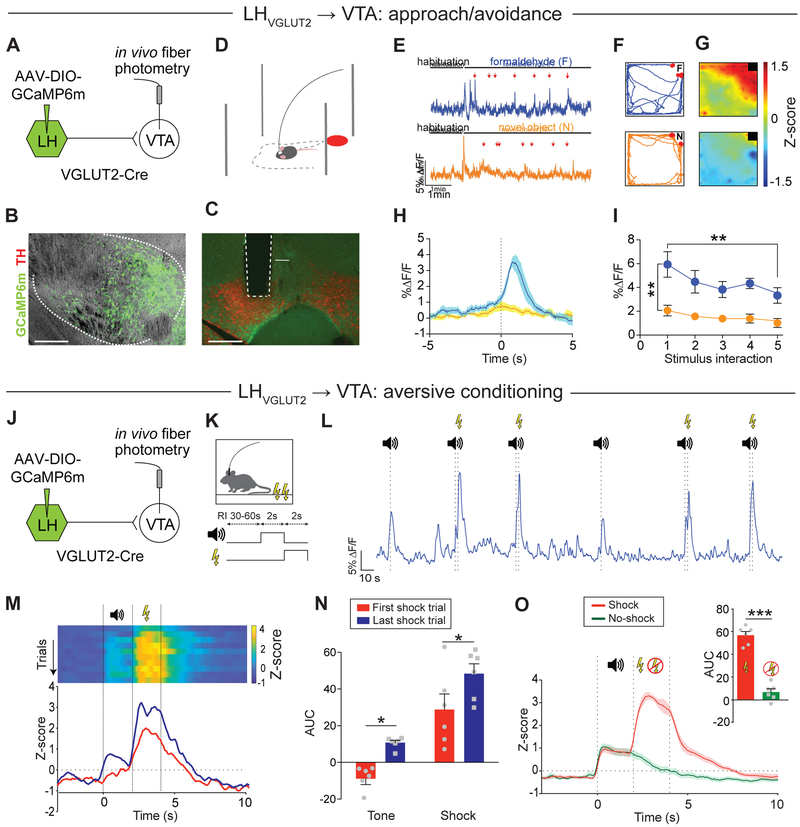
Figure 5. Activation of LHVGLUT2 inputs to the VTA by unconditioned and conditioned aversive stimuli.
(A) Schematic of experimental design.
(B) GCaMP6m (green) expression in LHVGLUT2 cell bodies (scale bar 200 μm).
(C) Optical fiber tract location in the VTA and LHVGLUT2 terminals expressing GCaMP6m (green) in the mVTA (red: TH; scale bar 500 μm).
(D) Schematic of approach/avoidance assay and fiber photometry setup (F: formaldehyde).
(E) Example responses to interaction with formaldehyde (top, blue) or to a novel object (bottom, orange). Red arrows: stimulus interaction (scale bars 5% ΔF/F/1 min).
(F) Example trajectories for interaction with formaldehyde (F; top) or novel object (N; bottom). Red dots: stimulus interaction.
(G) Heat maps for mean response intensity distribution in the open field area for interaction with formaldehyde (top) or novel object (bottom; warmer colors indicate increased activity).
(H) Mean response intensity during the first five stimulus interactions (time = 0, dashed line) with formaldehyde (blue) or a novel object (orange). Area of light shading represents SEM.
(I) %ΔF/F for individual stimulus interactions shows significantly greater responses for formaldehyde compared with novel object interaction. Note that the response intensity decreases significantly between first and fifth formaldehyde interaction (** p < 0.01; data represent means ± SEM).
(J) Schematic of experimental design.
(K) Schematic of aversive conditioning paradigm.
(L) Representative sample of LHVGLUT2 terminal activity in response to tone and foot shock. Note that both the ‘tone-shock’ trials and ‘tone-only’ (omission) trials increase activity in LHVGLUT2 terminals in the VTA (recorded during the omission session, i.e., 24h after conditioning).
(M) Top: Representative heat maps showing the individual Z scores for trials in which a 2 sec tone was followed by a 2 sec electrical foot shock (ordered from first to last shock trial). Bottom: Example responses to the tone and foot shock in an unconditioned animal (first shock trial, red) and after conditioning (last shock trial, blue).
(N) Mean AUC during tone and shock before (red) and after (blue) aversive conditioning (* p < 0.05; data represent means ± SEM).
(O) Comparison of Z score averages for trials in which a tone was followed by a foot shock (red) or was omitted (green; 67%-foot shock probability). Inset shows significantly increased activity (quantified as AUC) in omission (no-shock) compared with shock trials (*** p < 0.001; data represent means ± SEM).

