
Figure 4.
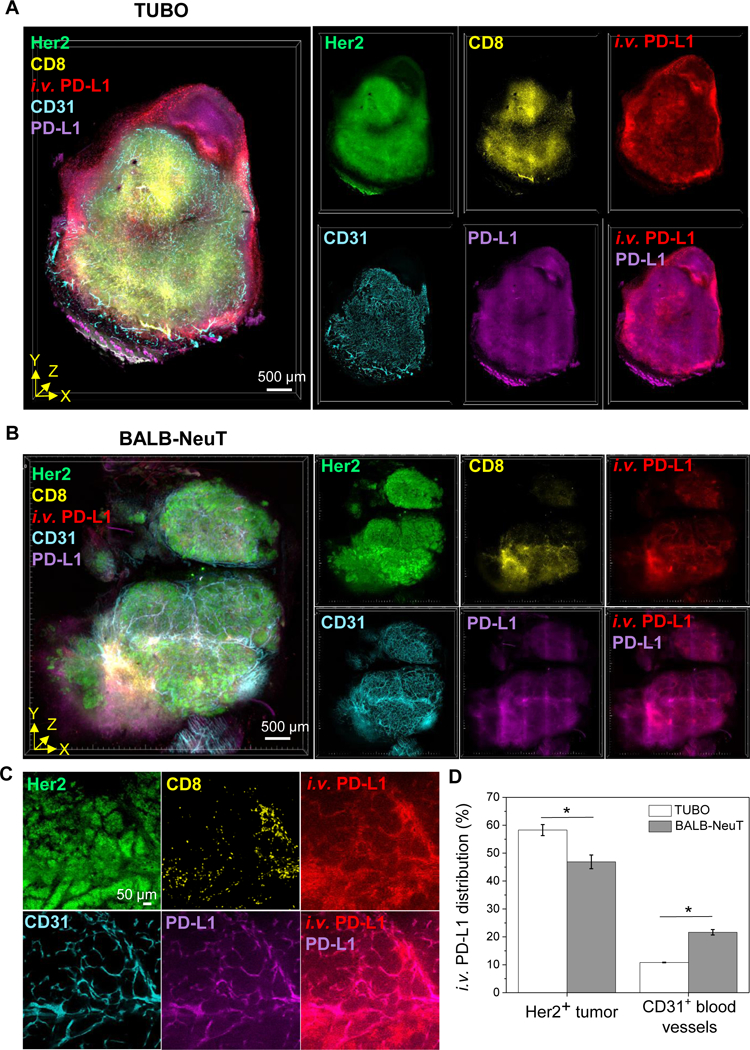
T3 analysis of anti-PD-L1 antibody distribution in tumor microenvironment with different PD-L1 expression patterns. A, B, 3D rendering of tumor perfusion of anti-PD-L1 antibody (red). At 1 day after fluorescent anti-PD-L1 antibody injection to TUBO (A) and BALB-NeuT (B) tumor mouse models, the tumors were excised, lightly fixed, sectioned, and immunostained for Her2 (green), CD8 (yellow), CD31 (cyan), and PD-L1 (magenta). Scale bar: 500 μm. C, 2D optical section images of BALB-NeuT tumor show PD-L1 expression in CD31+ vascular endothelium and colocalization of i.v. anti-PD-L1 with PD-L1+CD31+ microvessels. Scale bar: 50 μm. D, Relative quantification of i.v. anti-PD-L1 distribution (%) into Her2+ tumor and CD31+ vascular endothelium in the TUBO and BALB-NeuT tumor macrosections (n=3, mean ± SEM). *P<0.01.