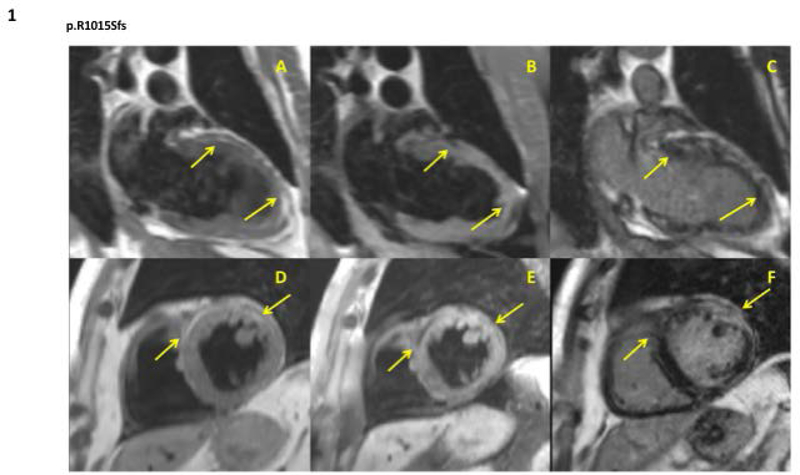
Figure 1. Cardiac phenotype in DSP mutation-carriers.
A representative cardiac MRI image from patient II:10 in family 4. It shows 2 chambers and short-axis LV turbo spin echo images with and without fat saturation and late gadolinium enhancement image on the same slice of the AC patient. Arrows in A and D indicate the white areas of fat infiltration that appear in black in B and E. Arrows in C and F indicate white areas of myocardial fibrosis.

