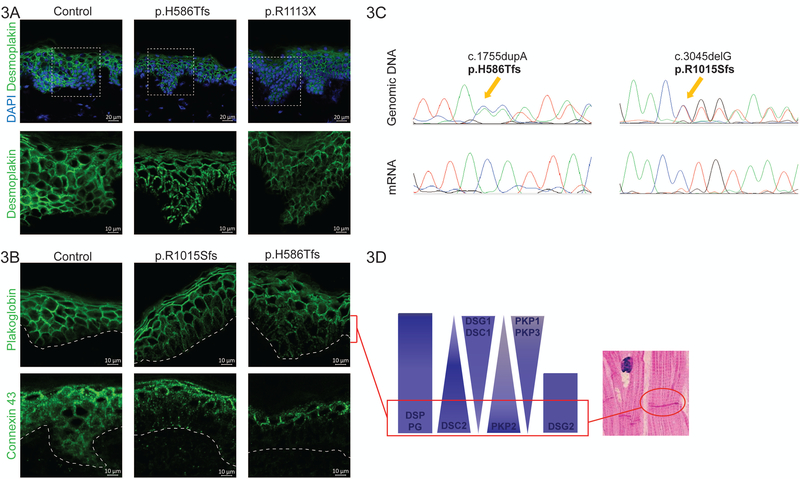
Figure 3. Molecular results in DSP mutation-carriers.
(A) is a collection of representative confocal images of DSP immunohistochemistry on non-lesional patient skin. Desmoplakin forms the most prominent aggregates in the index patient of family 2 (p.H586Tfs). The white dashed squares indicate the zoomed area indicated below without DAPI. Scale bar: 10 or 20 µm. (B) is a collection of representative confocal images of immunohistochemistry on non-lesional patient skin. The perforated white line indicates the border between the epidermis and the dermis. The suprabasal half of the epidermis has weaker plakoglobin and connexin 43 signal, while connexin 43 also seems to be more speckled and overexpressed on the surface when compared to control skin. Scale bar: 10 or 20 µm. (C) Representative DNA and cDNA sequences of patient skin in families 2 and 4. The orange arrows indicate the site of the duplication/insertion and the start of the frameshift in the genomic DNA. At the same site, we can only find the wild type sequence on the mRNA/cDNA level; the mutant allele has been degraded. (D) The schematic diagram illustrates the normal distribution of desmosomal proteins throughout the epidermal layer of the skin. The molecular composition of desmosomes in the lower part of the epidermis is similar to that of the intercalated discs in the myocardium (shown on histological inset image).

