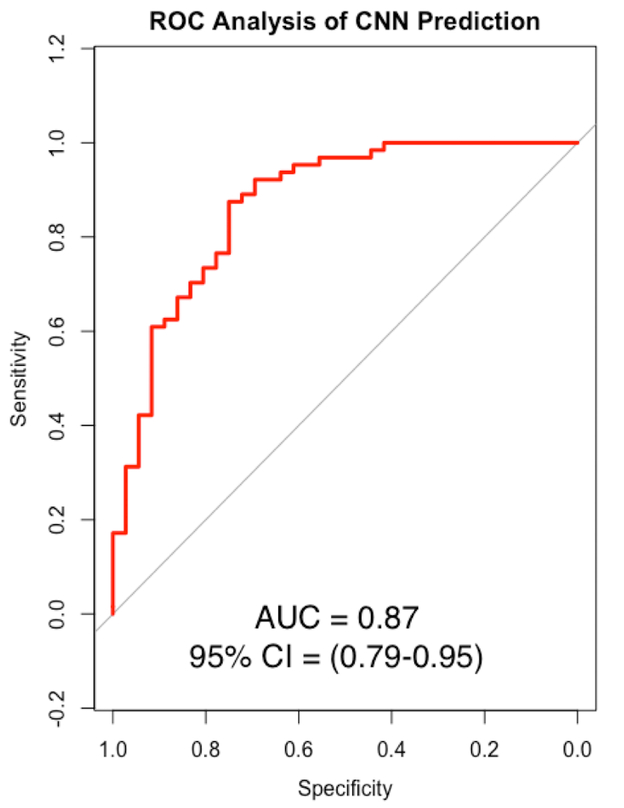
Figure 3: Receiver operating curve (ROC) analysis of algorithm performance.
ROC, Receiver operating characteristic; AUC, area under the curve; CI, confidence interval (DeLong). The red line represents the algorithm, while the gray line represents the baseline dominant classifier, which predicts the most commonly occurring class in the dataset (p < 0.0001).

