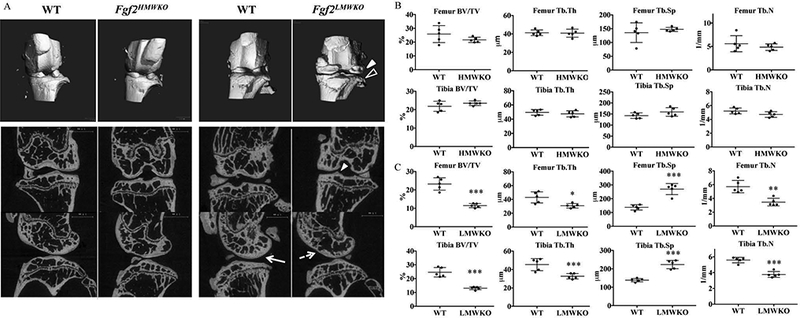
Figure 3. MicroCT imaging and histomorphometric analysis of subchondral bone of male Fgf2HMWKO, Fgf2LMWKO, and wild-type littermates at 6 months old.

A, Three-dimensional (3D) renderings reveal pitting and erosion (open arrowhead) and osteophyte formation (closed arrowhead) of Fgf2LMWKO knees, while Fgf2HMWKO and all WT knees maintain a smooth contour. High-resolution micro-computed tomography (μCT) 2D images of representative sections of all Fgf2LMWKO samples show osteophyte formation of tibia (closed arrowhead) and thinning of femoral subchondral bone (dashed arrow) compared to the thicker femoral subchondral bone (arrow) of the WT littermate. Fgf2LMWKO epiphyses display decreased trabecular thickness and number and increased trabecular spacing compared to WT and Fgf2HMWKO epiphyses. N=3–7/group. B, Histomorphometric parameters of Fgf2HMWKO and WT femoral and tibial epiphyses are similar. C, Histomorphometric parameters of Fgf2LMWKO femoral and tibial epiphyses reveal decreases in BV/TV, Tb.Th, and Tb.N and an increase in Tb.Sp compared to WT. BV/TV, trabecular bone volume; Tb.Th, trabecular thickness Tb.Sp, trabecular separation; Tb.N, trabecular number. Values are the means ± SD. *P <0.05, **P <0.01, ***P <0.001 N=5/group.
