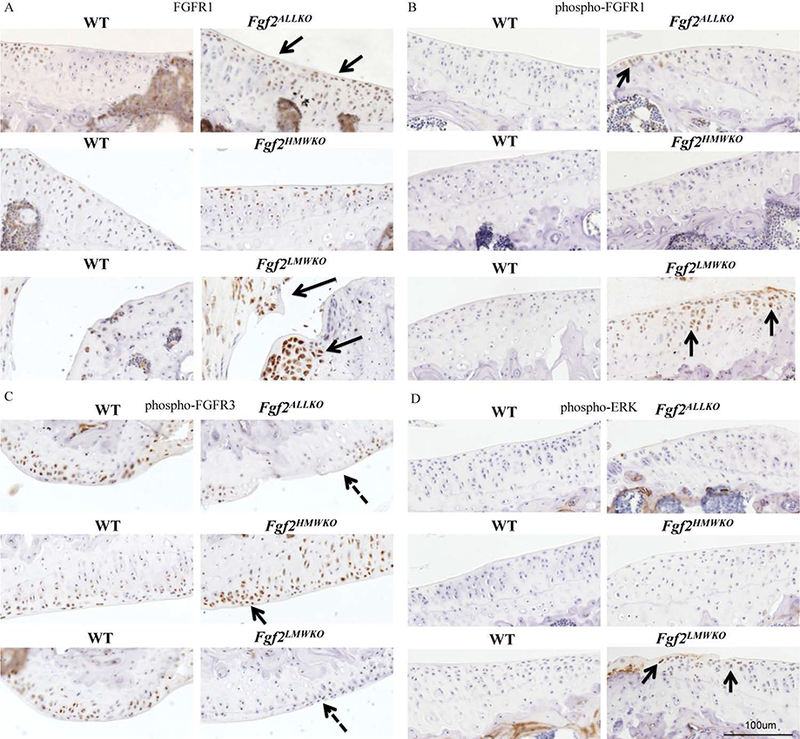
Figure 8. FGFR1, FGFR3, and ERK protein expression in 6 months old male Fgf2ALLKO, Fgf2HMWKO, Fgf2LMWKO, and wild-type littermates.

A, Immunohistochemical staining shows total FGFR1 expression was more robust in tibial articular cartilage of Fgf2ALLKO (arrows). FGFR1 was also increased in the joints of Fgf2LMWKO, particularly in the enlarged meniscus and developing osteophytes areas (arrows). Fgf2HMWKO had similar FGFR1 expression to the WT. B, phospho-FGFR1 was present in tibial cartilage of Fgf2ALLKO (arrow). Fgf2LMWKO cartilage had increased phopho-FGFR1 expression (arrows). C, phospho-FGFR3 expression was decreased in Fgf2ALLKO and Fgf2LMWKO femoral articular cartilage (dashed arrows) compared to WT, while Fgf2HMWKO had increased FGFR3 staining (arrow). D, phospho-ERK expression was only detected in Fgf2LMWKO cartilage (arrows). Magnification=10X, n=3/group.
