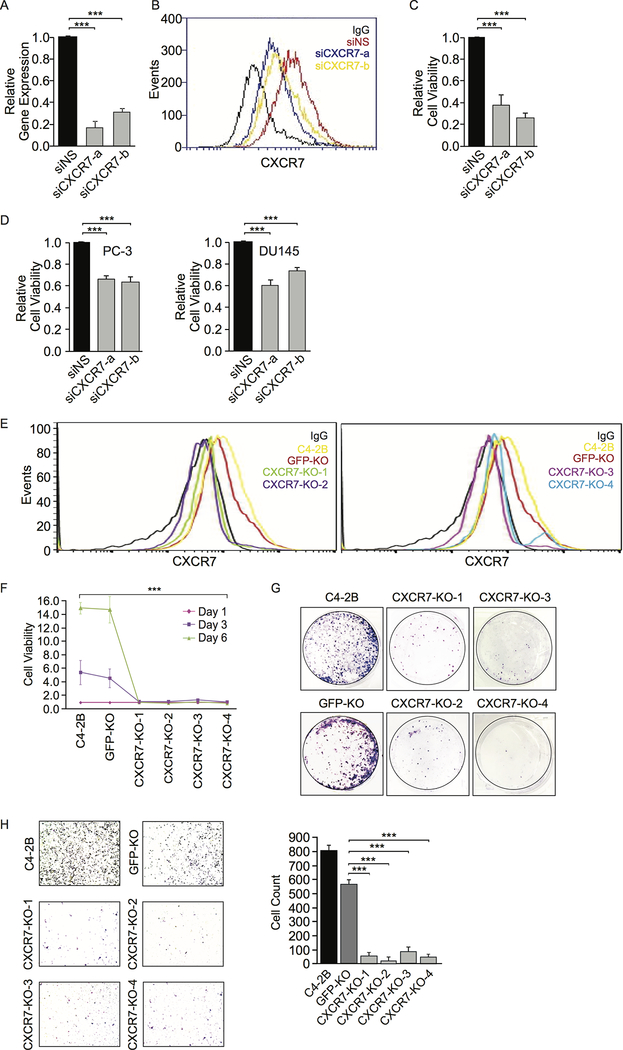
Figure 3.
CXCR7 knockdown (KD) or knockout (KO) decreases viability and migration in CRPC cells. A, CXCR7 mRNA expression levels in C4–2B cells were measured by RT-qPCR after CXCR7 siRNA KD. Gene expression with non-specific (NS) siRNA is defined as 1. B, CXCR7 protein expression on C4–2B cell surface was measured by flow cytometry after siRNA KD. C, C4–2B cell viability was measured by Alamar Blue assay after CXCR7 siRNA KD. D, PC-3 and DU145 cell viability was measured by Alamar Blue assay after CXCR7 siRNA KD. E, CXCR7 KO C4–2B cells were established using a CRISPR/Cas9 approach. Four cell clones (CXCR7-KO-1 and −2 on the left and CXCR7-KO-3 and −4 on the right) were selected for validation based on CXCR7 protein expression using flow cytometry. Non-specific IgG staining was used as a negative control. Parental C4–2B and GFP-KO C4–2B cells were used as positive controls. F, Cell viability of CXCR7 KO C4–2B cell lines was measured by Alamar Blue compared to control cell lines. G, Representative images of colony formation assays on CXCR7 KO C4–2B cells compared to control cell lines. H, Representative images of transwell migration assays in CXCR7 KO C4–2B cell lines compared to control cell lines. The images were quantified using ImageJ software. Data are representative of three independent experiments. Mean ± SD is plotted. P-value was determined by two-tailed Student’s t-test. *** p<0.0001.

