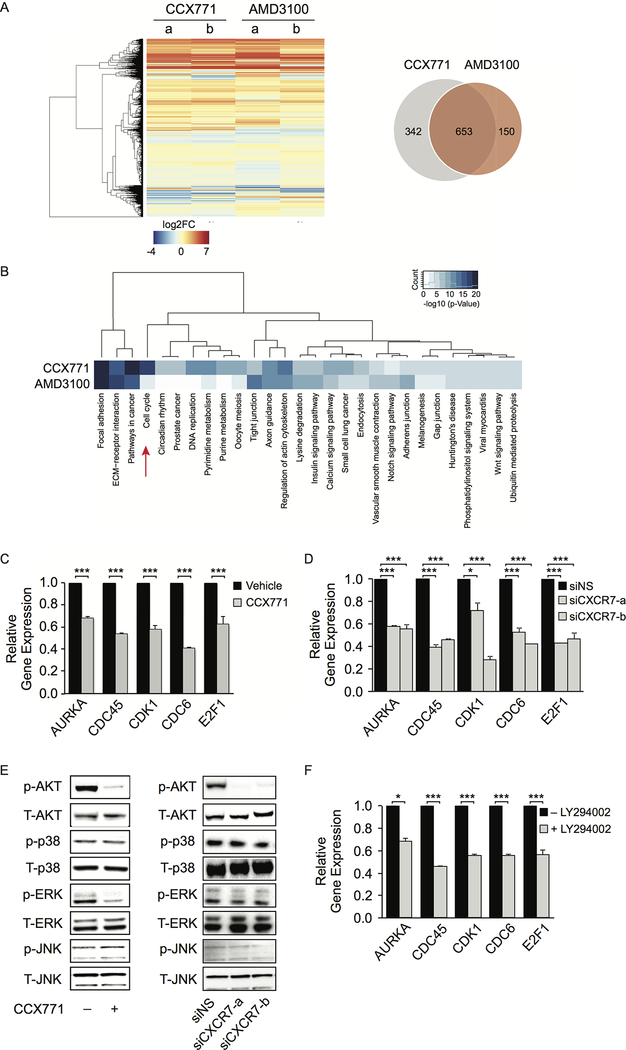
Figure 6.
CXCR7 induces M-phase cell cycle gene expression through AKT signal transduction pathway. A, Hierarchical clustering of gene expression alteration in C4–2B cells after treatment with CCX771 (5 μM) or AMD3100 (10 μM) for 16 hours in the absence of androgen. Venn diagram shows differentially expressed genes between the two groups. B, Heatmap showing the unsupervised clustering of the Gene Ontology (GO) terms enriched in CCX771- and AMD3100-altered genes. GO terms with -log10 (p-value) greater than 5 in either gene list were selected for analysis. C, Gene expression levels of top five altered cell cycle genes were examined using RT-qPCR after CCX771 (5 μM) treatment. D, Downregulation of five cell cycle gene expression was validated using RT-qPCR after CXCR7 siRNA knockdown (KD). E, Western blot showing phosphorylation of AKT, p-38, ERK, and JNK after CCX771 (5 μM) treatment for 24 hours or CXCR7 siRNA KD in C4–2B cells for 2 days. F, Expression levels of five cell cycle genes after treatment with LY294002 (10 μM) were measured by RT-qPCR. Data are representative of three independent experiments. Mean ± SD is plotted. p-value was determined by two-tailed Student’s t-test. *** p<0.0001.

