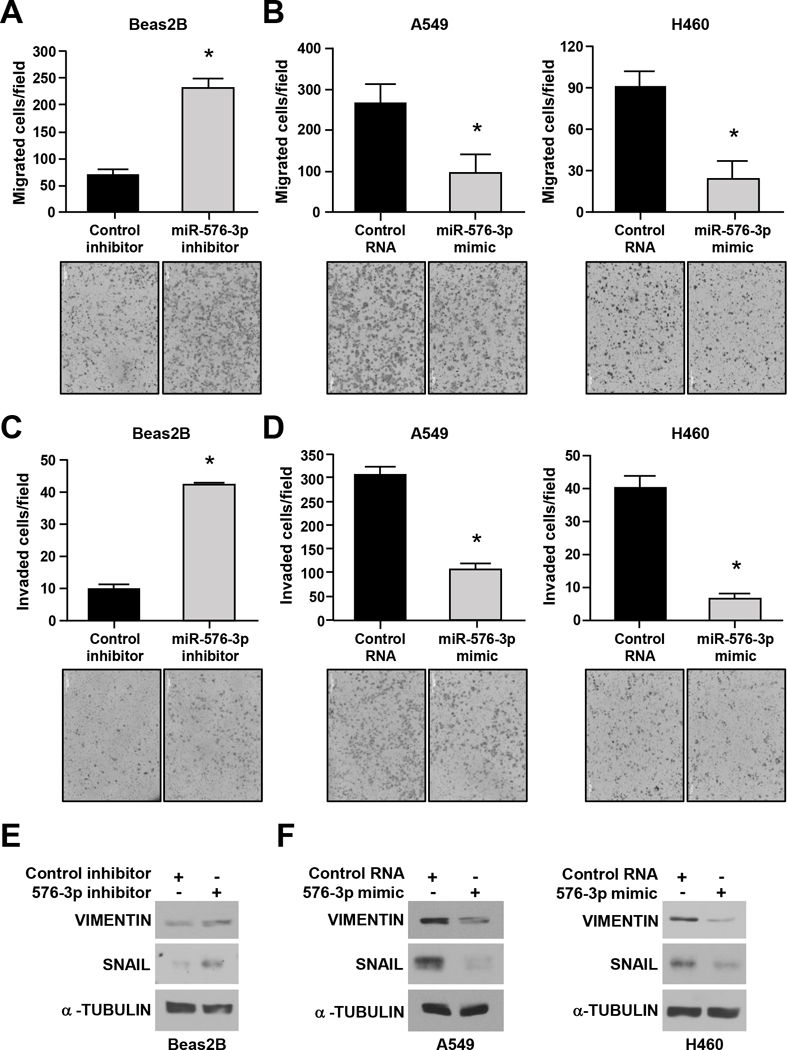
Figure 3. miR-576–3p alters mesenchymal marker expression and inhibits migration and invasion.

The indicated cell lines were transfected with the miR-576–3p inhibitor (A, C, E), miR-576–3p mimic (B, D, F), or control. (A-D) Transwell migration and invasion assays were performed; SEM; A, *P=9.7×10⁻³; B, A549, *P=0.028; H460, *P=2.0×10⁻³; C, *P=1.7×10⁻³; D, A549, *P=2.5×10⁻³; H460, *P=1.6×10⁻⁴; two-tailed t-test. Representative images shown (10×). (E, F) Western blots for the indicated proteins were performed. Data are representative of at least three independent experiments.
