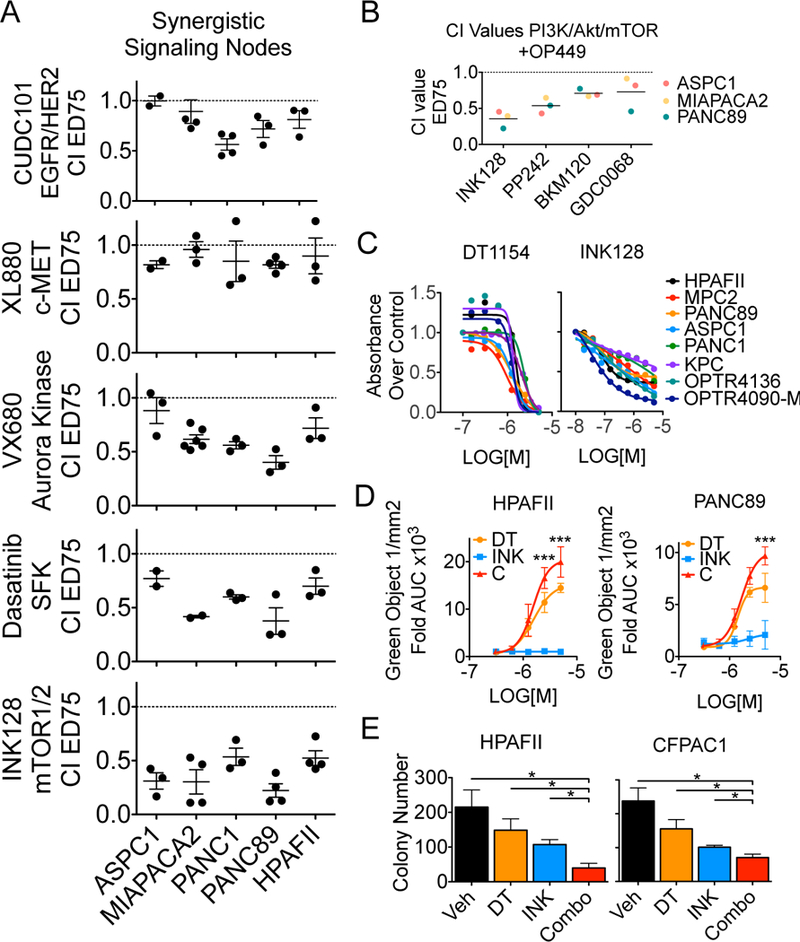
Fig. 1:

PP2A activation increases the cytotoxic effects of select kinase inhibitors. A. CI values at effective dose (ED) 75 for pancreatic cells lines treated with increasing concentrations of OP449 and select kinase inhibitors. Mean +/− SEM of biological replicates. B. CI values at ED75 of ASPC1, MIAPACA2, and PANC89 treated with INK128, PP242, BKM120, or GDC0068. Values for each cell line were generated from 2 (MIAPACA2- GDC0068) or 3 biological reps. Grand mean of all lines for each drug shown. C. PDA cell lines were treated with increasing doses of DT1154 (left) or INK128 (right) for 72 hours. Shown is the viability relative to Vehicle for each line. MIAPACA2 (MPC2) D. CellTox Green was added to HPAFII and PANC89 cells and then cells were treated with increasing concentrations of DT1154 and INK128. Fluorescent cells were imaged every 2 hours for 72 hours on an Incucyte Zoom. Shown is the area under the curve (AUC) generated from the green object count (1/mm2) over time relative to Vehicle control. Graph represents average of three biological replicates. ***P <0.001 by a 2-way ANOVA. E. HPAFII and CFPAC1 cells were plated in a soft agar colony assay and treated with Vehicle, 500nM DT1154, 10nM INK128, or combination. Colony number was quantified using ImageJ. Mean +/− SEM of three biological replicates. *p<0.05 by a two-tailed students t-test.
