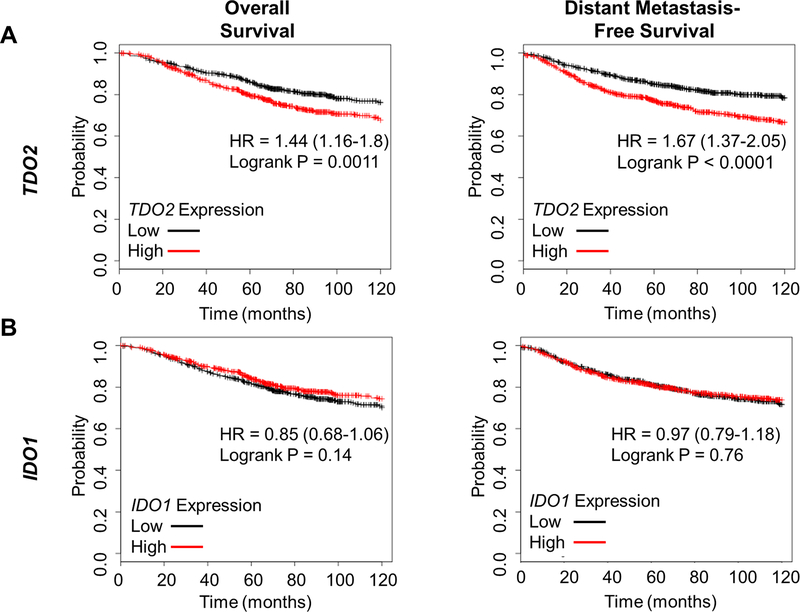
Figure 3: TDO2 expression correlates with breast cancer outcomes, while expression of the more commonly studied IDO1 does not.
(A) Patients were split into TDO2-high (red, n=699) or TDO2–low (black, n=703) groups based on median TDO2 gene expression. Overall survival (left) and distant metastasis-free survival (right) was plotted using KmPlot.com. (B) Patients were split into IDO1-high (red, n=701) or IDO1–low (black, n=701) groups based on median gene expression, and overall survival and distant-metastasis free survival was plotted. N=1402, hazard ratios are given with 95% confidence intervals, logrank test.

