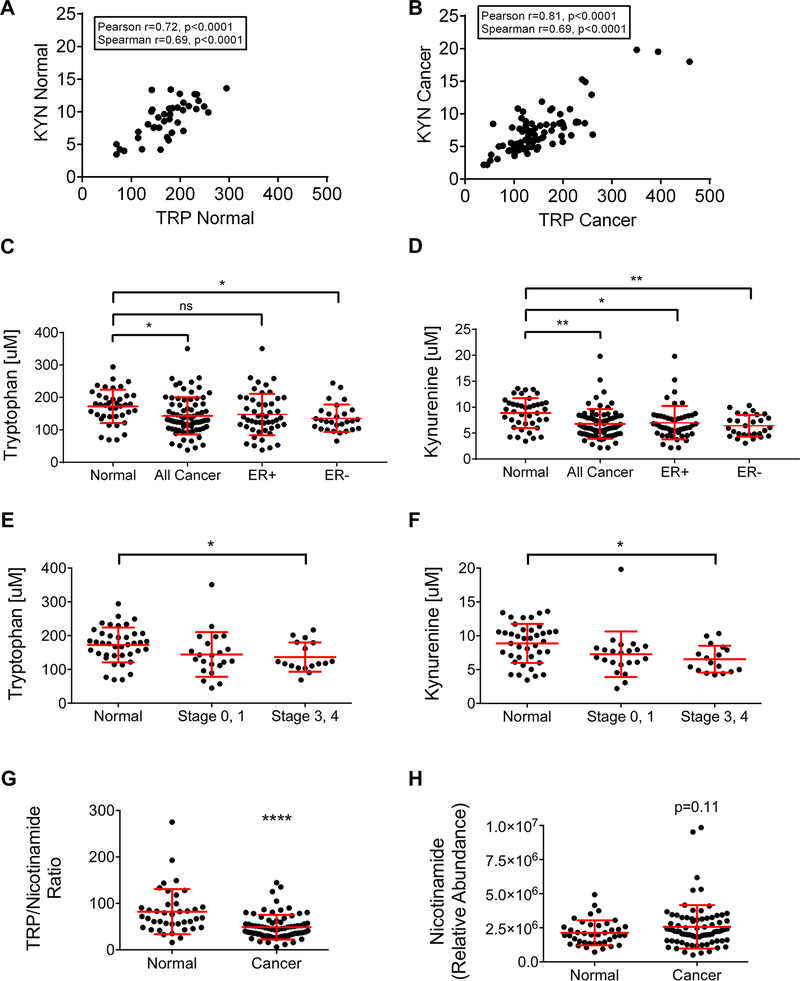
Figure 4: Tryptophan and kynurenine are reduced in breast cancer plasma.
Ultra-high performance liquid chromatography/mass spectrometry was used to measure tryptophan and kynurenine concentrations and nicotinamide abundance in the plasma from normal women and women with breast cancer. The concentrations of tryptophan and kynurenine correlate significantly and positively in both normal (A) (n=40) and breast cancer patient (B) (n=77) plasma by Pearson and Spearman tests. Comparison of tryptophan (C) and kynurenine (D) concentrations in plasma from normal women, all breast cancer patients in the cohort, and ER+ versus ER-breast cancer patients. Mean with standard deviation, *p<0.05, **p<0.01, one-way ANOVA and Tukey’s multiple comparisons test. Comparison of tryptophan (E) and kynurenine (F) concentrations plotted by breast cancer stage is shown. Mean with standard deviation, one-way ANOVA and Tukey’s multiple comparisons test. (G) Comparison of the ratio of tryptophan (TRP) to nicotinamide between plasma from normal women and women with breast cancer. Mean with standard deviation, **** p<0.0001, unpaired t-test. (H) Comparison of the relative abundance of nicotinamide in the plasma from normal and breast cancer patient plasma. Mean with standard deviation, p=0.11, unpaired t-test.

