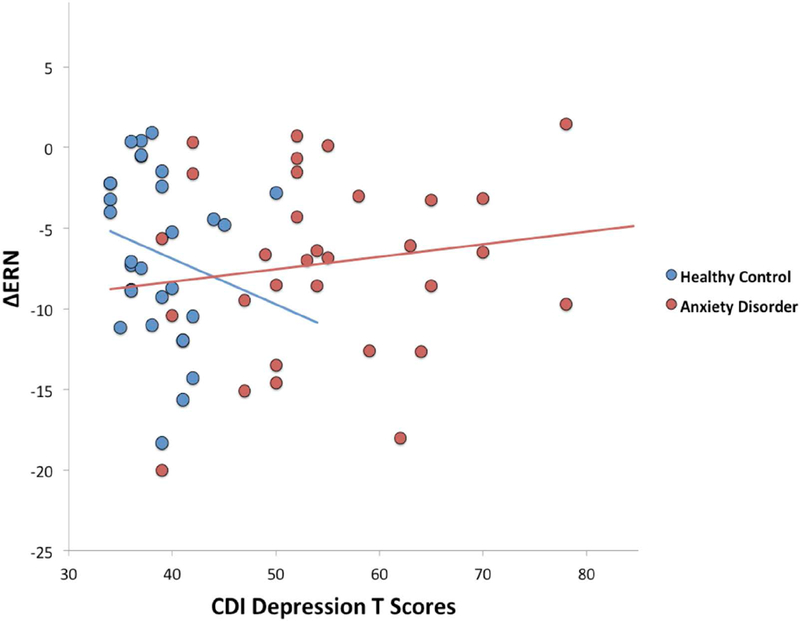
Figure 3.

Scatterplot illustrating the effect of depressive symptoms on the ΔERN by diagnostic group (anxiety disorder vs. healthy controls). Increases in the ΔERN are represented by values that are more negative in polarity. ΔERN = difference between error-related negativity and correct-related negativity; CDI= Children’s Depression Inventory
