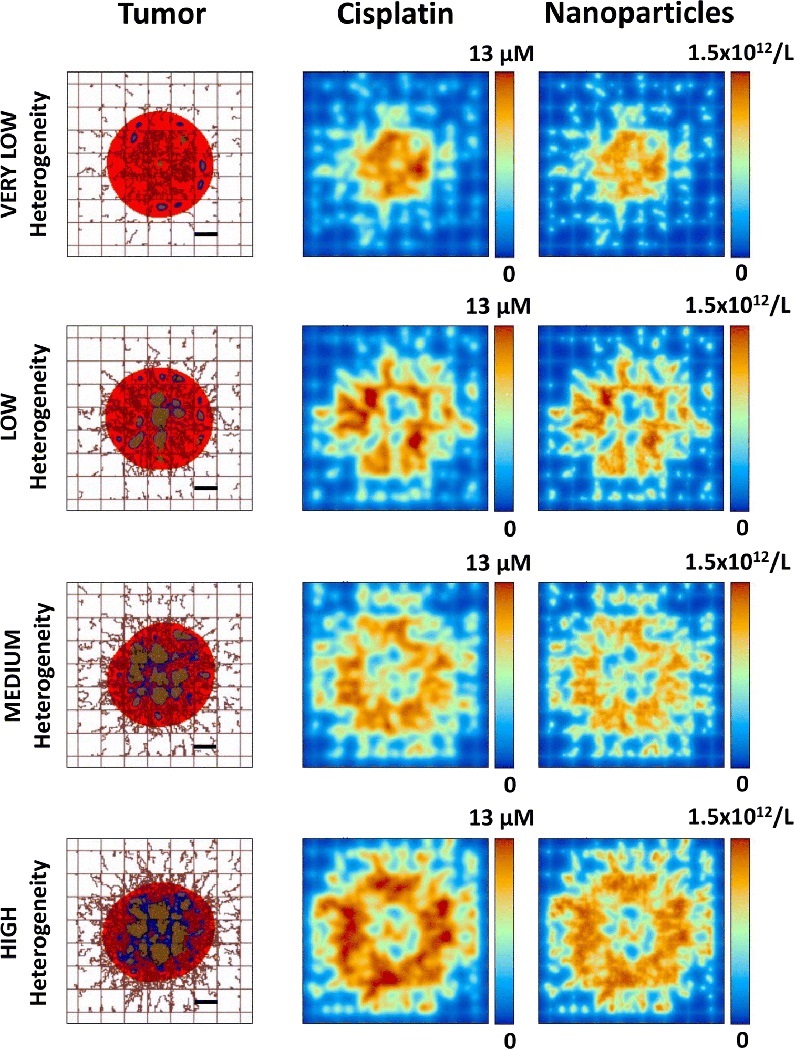
Figure 4.

Representative simulation images of vascularized tumors with various levels of heterogeneity shown at the start of treatment (immediately after bolus injection) with cisplatin-loaded nanoparticles. At this time, nanoparticles and drug can be seen within the system but the tumor tissue has not yet responded to the effect of the drug. Red: proliferating tissue; blue: hypoxic tissue; brown: necrotic tissue. Bar: 250 μm.
